We Need Your Support
Donations are tax deductible and you will receive a charitable tax receipt for 100% of your gift.

Act Now

Empower U: Learn to Access Your Disability Rights Training on Canadian Human Rights, the Convention on the Rights of Persons with Disabilities (CRPD) and its Optional Protocol (OP) training aims to increase awareness of how to address discrimination using more familiar Canadian human rights laws such as Human Rights Codes and the newer international Convention on the Rights of Persons with Disabilities (CRPD). This is training for persons with disabilities by persons with disabilities. The training is part of a project funded by Employment and Social Development Canada and implemented by the Council of Canadians with Disabilities (CCD) in collaboration with Canadian Multicultural Disability Centre Inc. (CMDCI), Citizens With Disabilities – Ontario (CWDO), Manitoba League of Persons with Disabilities (MLPD) and National Educational Association of Disabled Students (NEADS). Read more.
What is Happening to Disability Income Systems in Canada?
Insights and proposals for further research
John Stapleton
Anne Tweddle
Open Policy
Katie Gibson
Katie Gibson Consulting
February 2013
This project was funded in part by the Social Sciences and Humanities Research Council (SSHRC), through Disabling Poverty/Enabling Citizenship, a CURA project led by the Council of Canadians with Disabilities (CCD). The opinions and interpretations in this publication are those of the author and do not necessarily reflect those of SSHRC.
Contents
- Foreword
- Angelica: then and now
- Bob: then and now
- Executive summary
- Introduction
-
Overview of disability benefits in Canada
- Employment Insurance sickness benefit (EI Sickness)
- Canada Pension Plan and Quebec Pension Plan disability benefits (CPP–D and QPP-D)
- Veterans' disability pensions and awards
- Private disability insurance
- Workers' compensation
- Social Assistance—disabled component
- Disability tax credits
- Registered Disability Savings Plan
- Summary
-
Trends in disability benefit expenditures: Social assistance disability income support is significant, is growing, and, in Ontario and westward, is growing faster than other supports
- Canada
-
Ontario and westward
- Ontario
- Manitoba
- Saskatchewan
- Alberta
- British Columbia
-
Quebec and eastward
- Quebec
- New Brunswick
- Prince Edward Island
- Nova Scotia
- Newfoundland and Labrador
- Observations and areas for future research
- Conclusion
- Annex 1: Provincial Data by Program, 2010-11
- Annex 2: Provincial Data, Change in Expenditures by Program, 2005-06 to 2009-10 and 2010-11
- Annex 3: Sources and Methodology
- Annex 4: Data sources relating to demographics and labour market participation of people with disabilities
Foreword
Several years ago, I was delivering meals on wheels with my mother on a route that we have now shared for the past 25 years. Knowing that I had worked for years in social programs, she mentioned that she had a friend who was applying for "disability". She asked "how much do people get on disability?" I quickly replied that this would depend on the disability income program for which she was applying. I thought this was a reasonable response, and her reaction surprised me: she became a little upset and said that she had asked a very simple question and now I was answering her with another question. She narrowed her question, asking how much a woman over 60 applying for "disability" after working all her life would receive. I grimaced and quickly changed the subject because any reasonably accurate response would have been the same as my previous one.
This conversation got me thinking about Canada's many disability income systems and different types of payments. I discovered that there are eight disability income systems in Canada (including the RDSP), and all have varying types of benefits paid under varying circumstances. In 2010, the Institute for Work and Health in Toronto published a small paper I wrote with colleague Stephanie Procyk called "A patchwork quilt: Income security for Canadians with disabilities".[1] In that report, we described the various disability systems in Canada and noted that almost $30 billion is spent on these programs.
When I presented a slide show associated with that paper on several occasions, one of the common themes in the question period related to the vast differences among these programs. From Workers' Compensation to Canada Pension to social assistance, each program is rooted in a different era with different philosophies about how payments should be made and to whom.
The most fundamental difference between the various programs relates to their attitude toward work. In earlier times, we compensated persons with disabilities because they could not work, and we did not think much about their future. We insured them against the hazard of disability; however it was defined by federal or provincial authorities or by private insurers. In modern times, we want disability income programs to encourage persons with disabilities to work. Now we aim not only to compensate the person, but also to find ways to overcome the disability in favour of a future in work. However, once cast in a particular mold of compensation, systems do not evolve as times and values change. We have created a set of disability income systems that do not sit well beside each other, as some set out to prevent work while others insist on it. As a set of systems, they are not people centred; rather they are era-centred.
In 2008, I wrote a paper with Anne Tweddle called Navigating the Maze[2] in which we noted that social assistance as a residual program not meant to replace other programs appeared to have the most modern approach to work incentives and work orientation:
Social assistance was not designed to be a disability income program but over time, has become the clear substitute. The key irony here is that:
- The contributions-based programs [(i.e. not social assistance)] generally do not provide income support when a recipient returns to work (except through specific return to work incentives and limited capped allowable earnings); while
- Those programs (social assistance) that serve people who have traditionally been too disabled to work, robustly support entering the workplace with money, supports, and benefits.
Another important consideration is the impact of the changing labour force on disability program usage. With the trend to contract work and self-employment, workers who may previously have been eligible for work-related compensation now find themselves with no coverage. Angelica and Bob's stories below illustrate this phenomenon.
Angelica: then and now[3]
Angelica is an office cleaner in her early 60's living in Toronto. She started work in 1975 and has suffered two major workplace injuries. The two injuries took place far apart in her working career. In each case, the injuries were similar and she was off work for over a year. But her coverage under various parts of Canada's social safety net could not have been more different.
Angelica suffered her first major workplace injury in 1993 after she had been working for 18 years. Angelica worked for the government and was paid $21 an hour. She was saving 5% of her net pay.
When she was injured, she was able to receive workplace medical attention. The government still had a nurse's station with a physician on call. She was attended to immediately and got into hospital quickly.
Angelica got time off work at full pay and was able to deploy a robust bank of sick days that she had not used until the accident. She received the benefits of a multifaceted workplace program that provided rehabilitation and other services like orthotic supplies, physiotherapy and chiropractic services without fees.
Following her in-house government coverage, Angelica qualified for Workers' Compensation, and she also received 15 weeks of sickness benefits through Employment Insurance followed by regular EI benefits for the entire time she was off work. Angelica was comforted to know that had her injury resulted in a complete and permanent disability, she would have qualified for CPP disability benefits. At no point did Angelica have to contemplate a welfare application or social assistance for people with disabilities.
In 2011, Angelica sustained a workplace accident similar to the one she suffered in 1993. She now had 37 years' experience completing the same tasks, in the same place.
However, in 1998, the work she was doing was contracted out to a firm that had bid on the cleaning contract for government. Overnight, Angelica was offered a position as a self-employed contractor with the new company at a pay rate equivalent to the minimum wage. By 2011, Angelica was making the equivalent of $10.25 an hour, about one half (in nominal terms) of what she made before the 1998 changes.
When Angelica sustained her 2011 injury, there was no workplace infirmary and she phoned 911. New and heavy security in the government building delayed Angelica's hospital visit by a few minutes.
As a so-called self-employed contract worker, Angelica had no sick days and no other source of income. She had no sick days, no access to rehabilitation, and no workplace program because in technical terms, she was not working. She had to pay for her own orthotics and because physiotherapy and chiropractic were delisted as insured services, Angelica faced paying for all uses of these services at full fee rates.
Angelica might have qualified for Workers' Compensation, but she would have had to demonstrate to the workers compensation board that her relationship was, in principal, one of an employer-employee. She did not know that, and although she could have paid into CPP—both the employer and employee portions—she believed she could not afford these payroll levies.
Angelica was also worried by the fact that she would not have qualified for CPP disability benefits had her injury resulted in a permanent disability. She would qualify for CPP-D if fully disabled as she would have been paying both the employer an employee portion of the payroll levy.
As a self-employed contractor, Angelica did not pay into the EI program and therefore did not qualify for the standard 15 weeks of sickness benefits through Employment Insurance nor did she qualify for regular EI benefits.
With her lower rate of pay, Angelica had already spent all of her savings. As her marriage had ended partly due to financial pressures in 2003, Angelica was not eligible for the Allowance under the Old Age Security system when she turned 60 in 2010.
Once Angelica was sufficiently mobile, she applied for welfare (Ontario Works) of $606 a month with an application in place for the Ontario Disability Support Program (ODSP). If she takes early CPP, it will be deducted from her welfare cheque or disability at 100%. ODSP will also force her to apply for CPP-D. Otherwise, she will wait until age 65 when higher monthly CPP retirement benefits will further reduce her Guaranteed Income Supplement (GIS) entitlement.
Angelica represents a new class of Canadians with disabilities who, unlike those in the past, are forced to go on welfare. Cruelly, despite working 37 years at the same job, as soon as she accesses welfare, Angelica is viewed by many as a failure and a burden.
Bob: then and now
It started when Bob was a university student back in the 1990's. He thought had everything under control. He had finally moved away from his dysfunctional home, escaping the beatings and the constant walking on eggshells. Suddenly, he found that he could no longer concentrate on his studies, and some dark feelings that he could not control came over him. He was not the same fun-loving person that he had been just a year earlier.
After talking to his friends, Bob concluded that he needed help. He contacted the university's counselling service. The counsellors were sympathetic—they told Bob that a lot of young people have trouble with their studies and that this was a normal part of university life. They offered study tips and assured him that he would get over it. They did not ask about his background or about the debilitating bouts of darkness—the euphoria sometimes followed by the abyss.
And Bob did get over it for a while. He finished the school year and got a summer job that involved strenuous physical activity. He liked the work, as it took his mind off that part of his psyche where he did not want to go. But the next year the darkness came back. Bob stopped looking after himself. He returned to the counselling centre, where one of the counsellors asked if he would like to take some psychological tests. He agreed.
After a few weeks, the diagnosis came back that he was depressed and that he may be harbouring some deep seated hostilities towards some family members. He agreed to further testing, but thought things were improving and the small dose of valium seemed to be helping. Or was he imagining it?
Bob was planning to graduate with a four year degree, but he cut it off at the three year B.A. He returned to his summer job full time, but soon he was laid off and bounced around from job to job. He collected EI, and when that ran out, he managed to hang on to work at a fast food place but found the job increasingly stressful. It just wasn't working out. Finally Bob bunked in with two other fellows and applied for welfare.
Some days Bob would feel so "up" that he could take on the world. Other days—now more frequent—were filled with darkness. Months and finally years passed in a fog. Bob bounced from clinic to clinic and doctor to doctor, but he could not gain any traction.
Then in 2009, Bob attended a workshop at a legal clinic and learned that he could apply for ODSP if he were sick. Bob did not think he was sick, but he knew things were horribly wrong. He was not working and was still on welfare. The jobs and placements that they provided to him were all dead ends. And here he was a University graduate.
Bob got a referral from the legal clinic to the Centre for Addiction and Mental Health. This time he took a series of tests and was diagnosed with bi-polar disorder and post-traumatic stress disorder (PTSD). Finally this explained it. His application for ODSP went to the government and after a wait of six months, he learned that his application had been accepted.
Practically overnight, Bob was getting a lot more money because ODSP payments are almost 80% higher than Ontario Works payments. He was no longer being sent to do drudge work and volunteer jobs that led nowhere. He began to get therapy and was put on medication. He felt much better and started taking better care of himself. He came to understand how much his early experiences had hurt him.
Bob had always wanted to work, but he knew that he needed stable housing to even dream of work. In 2011, he got the housing he required. He enrolled in an employment program and began getting work experience.
Bob would not have gotten ODSP in the past. The system would not have recognized his PTSD and would not have considered his bipolar disorder as being severe enough to ground eligibility. His years on Ontario Works had further ravaged him. Bob is a new face of disability.
Executive summary
This paper summarizes our findings on recent expenditures on persons with disabilities in Canada. I first looked at this issue when I co-authored a paper with Anne Tweddle called Navigating the Maze, where we examined spending on programs for persons with disabilities in 2005-06. Since then we have continued to monitor them. In 2009-10 we noted a nationwide trend towards pronounced increases on social assistance spending for the disabled compared to other programs. As we refined the data and broke it down by province, a dichotomy emerged between two regions in Canada.
Nationally, social assistance disability income expenditures are growing faster than other programs overall. Between 2005-06 and 2010-11 they grew from $23.2 billion to $28.6 billion, an increase of nearly 30%. In a number of Canadian provinces—mostly Ontario and westward—social assistance disability expenditures are growing much faster than expenditures for other disability income programs. In these provinces (with the exception of Saskatchewan), increases in social assistance disability expenditures have far exceeded that of all other programs. We observe that low-income people with disabilities, particularly in the five westernmost provinces, who would otherwise be supported by work-triggered disability income programs are either exhausting the benefits available through these programs or finding themselves ineligible for these benefits.
This is not the case in the eastern provinces and Quebec. In all these provinces, social assistance disability expenditures have decreased as a percentage of total spending on disability income support over the same time period. In fact, EI sickness benefit expenditures in Newfoundland and Labrador, Prince Edward Island and New Brunswick showed the largest increases, between 45 and 50%.
Why are there such divergent patterns between the provinces? Perhaps more importantly, why are people with disabilities in certain parts of the country coming to rely so heavily on welfare for their basic income support?
Percent Change in Social Assistance Spending on the Disabled by Province
2005-06 to 2010-11
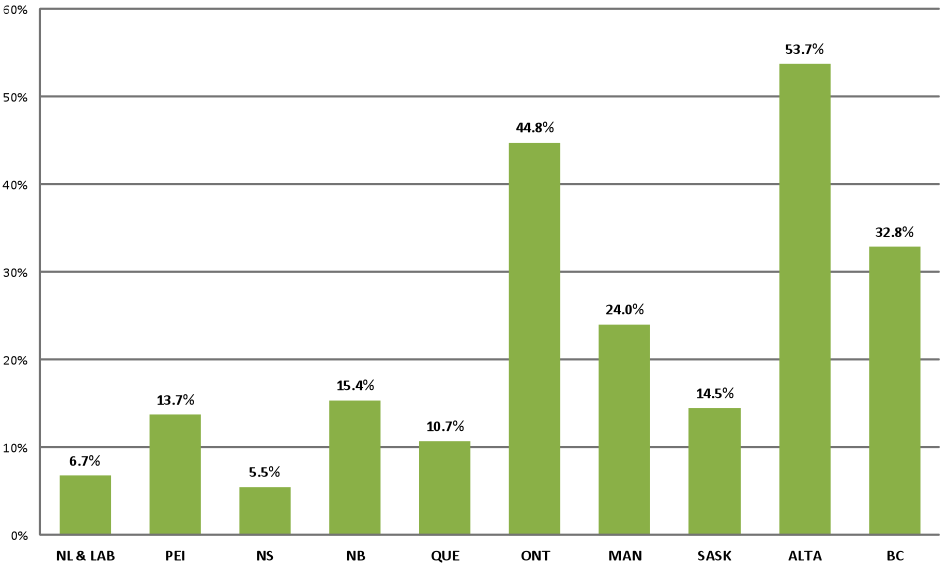
- Newfoundland and Labrador
- 6.7%
- Prince Edward Island
- 13.7%
- Nova Scotia
- 5.5%
- New Brunswick
- 15.4%
- Quebec
- 10.7%
- Ontario
- 44.8%
- Manitoba
- 24.0%
- Saskatchewan
- 14.5%
- Alberta
- 53.7%
- British Columbia
- 32.8%
Our goal is to ask why this trend toward welfareization of disability is occurring and to pinpoint some questions for further research. With this beginning, a robust new line of inquiry can be opened to shed light on the real reasons for relative growth.
Introduction
Income support for Canadians with disabilities takes a number of forms. In the post-millennial period, and especially since 2005-2006[4], support in the form of social assistance for persons with disabilities has consistently been the largest set of income support programs. Notably, social assistance has been growing faster than other disability income systems. Other disability income systems, detailed below, include Employment Insurance sickness benefits (EI Sickness), Canada Pension Plan/Quebec Pension Plan disability benefits (CPP-D and QPP-D), Veterans' disability pensions and awards, private disability insurance, workers' compensation, disability tax credits, and the Registered Disability Savings Plan.
Our research shows that disability income expenditures[5] are on the rise in Canada. Total income support for Canadians with disabilities was an estimated $28.6 billion in 2010-11, an increase of 22.9% since 2005-06.
Many factors contribute to this growth. One is an aging population. In 1971, for example, the median age of Canadians was 26.2, while in 2012 it was 40.[6] Further, in 2012, Canadians aged 65 and older accounted for 14.9% of the population as compared to 7.9% in 1971. This has a number of repercussions. For example, more Canadians are contracting late onset disabilities and are living longer with early onset or birth disabilities.
Other related factors include extended life spans for people with disabilities, growing numbers of people living in poverty[7], and ongoing difficulties faced by people with disabilities in accessing the workplace[8]. An additional factor is the marked increase in Canadians seeking income support as a result of mental illness.[9]
Trend toward "welfareization" of disability support
Social assistance disability expenditures in particular are rising fastest in Canadian provinces Ontario and westward with the exception of Saskatchewan; the total for all provinces confirms the trend in Canada overall. In this paper, we will demonstrate that other forms of disability income support expenditures (i.e. those other than social assistance) are not increasing at the same rate as social assistance disability income programs in Canada's five westernmost provinces.
In the past, "work-triggered" programs—those that are predicated on workforce attachment—were expected to do more of the "heavy lifting", while social assistance programs were residual, providing support to those who could not access work-triggered supports. In Ontario and westward, social assistance disability income programs appear to be doing more of the "heavy lifting" in the disability income arena.[10] As a corollary, in these provinces, the other work-triggered disability income systems seem to be doing less. We conclude that social assistance is becoming the dominant income support system for people with disabilities in these provinces; that there is a trend toward the "welfareization of disability." By this we mean that social assistance is becoming the main income security program for persons with disabilities while other programs take a back seat.
The purpose of this paper is to foster dialogue and further inquiry into these trends and to identify some hypotheses for further research.
Overview of disability benefits in Canada
Canada has eight major disability income systems:
- Employment Insurance sickness benefits (EI Sickness)
- Canada Pension Plan/Quebec Pension Plan disability benefits (CPP-D and QPP-D)
- Veterans' disability pensions and awards
- Private disability insurance
- Workers' compensation
- Social Assistance—disabled component
- Disability tax credits
- Registered Disability Savings Plans
We describe each in the sections that follow.
Employment Insurance sickness benefit (EI Sickness)
The Employment Insurance system is administered by the federal government. The Employment Insurance (EI) Sickness Benefit provides benefits for up to 15 weeks for temporary disabilities. To qualify, the worker must demonstrate that regular weekly earnings have decreased more than 40% due to sickness, injury or quarantine, and that 600 insured hours have accumulated over the previous 52 weeks or since the worker's last claim.
The basic benefit rate for EI Sickness is 55% of a worker's average insured earnings, up to a yearly maximum insurable amount. Employment Insurance Sickness Benefits are administered as a "last-payer" program. Benefits are reduced when beneficiaries receive support from workers' compensation, group insurance income, and accident compensation for lost wages.
Canada Pension Plan and Quebec Pension Plan disability benefits (CPP–D and QPP-D)
The federal government shares with the provinces jurisdiction over the Canada Pension Plan, while Quebec administers the Quebec Pension Plan. Both are compulsory contributory social insurance schemes that provide income and protection in the event of retirement, disability, or death. Employers and employees contribute to CPP and QPP as do self-employed.
Eligibility for the CPP-D is based on a stringent definition of disability: "severe and prolonged disability such that the person is incapable of gainful employment." The QPP-D requires a "severe and permanent disability"; the definition of severity includes an assessment of the individual's ability to engage in gainful work. Minimum contributions are also required. CPP-D is treated as a "first-payer"[11] by private long-term disability plans, provincial social assistance programs, and provincial workers' compensation agencies. QPP-D is not necessarily treated as a "first-payer".
Veterans' disability pensions and awards
Veterans or members of the Canadian Armed Forces are eligible for a disability benefit administered by Veterans' Affairs Canada, also a federal program. Those eligible are Canadian Forces veterans, Merchant Navy veterans of the Second World War or Korean War, current or former members of the regular or reserve force, or civilians who served in close support of the Armed Forces during wartime.
Entitlement to a disability benefit under the Veterans' Affairs program is based on adjudication of the attribution of disability to exposures arising from service in the Canadian Armed Forces and the severity of disability. The disability benefit is reduced if the recipient is receiving benefits from an employment-based group disability insurance plan.
Pursuant to the New Veterans Charter, which came into force on April 1, 2006, disabled veterans are now eligible for a disability award. This may be paid as a lump sum, annual payments, or a combination of the two.
Private disability insurance
Many employers offer employment-based short- and long-term disability (STD/LTD) plans. Typically, premiums are paid by employees, although the share of premiums paid by the employer and employees varies. Most plans provide a two-year period of benefits for persons unable to perform their pre-disability occupation and who have medical evidence of a permanent or long-duration impairment. Thereafter benefits are only provided if the beneficiary is unable to perform any occupation for which the person is reasonably trained or educated. Plan benefits are scheduled at 50-75% of pre-disability income. Benefits are reduced dollar-for-dollar by any CPP-D or workers' compensation benefits.
Workers' compensation
Provincial workers' compensation agencies administer income security benefits for wage losses arising from disabling disease or injury caused by work exposures. The federal government also administers a workers' compensation program for federal employees. Employers pay the insurance premiums. The large majority of recipients of provincial workers' compensation wage replacement benefits experience temporary disability. However, provincial workers' compensation agencies also administer benefits that acknowledge permanent impairment arising from a work-related injury or illness. Permanent partial disability benefits are payable to age 65. Benefit levels vary slightly among plans.
Social Assistance—disabled component
The social assistance programs of all Canadian provinces provide benefits to persons with a disability. In most provinces, eligibility for benefits is determined by a combination of the duration of disability and needs-testing. Disability status is established by a doctor's certificate indicating the severity of disability, but the process and definition of disability for social assistance varies among provinces. Most provinces adjust benefits to account for earnings and other forms of income, including disability income security benefits.
Social assistance programs and the level of benefits paid vary between provinces. For example, Alberta's Assured Income for the Severely Handicapped (AISH) program provides flat-rate benefits that are not needs tested. In addition, First Nations persons living on reserves receive assistance through Aboriginal Affairs and Northern Development Canada.
Disability tax credits
The primary tax measure related to disability administered by the Canada Revenue Agency under the Income Tax Act is the Disability Tax Credit (DTC).
The Disability Tax Credit is available to persons with an impairment of physical or mental functions that has lasted or is expected to last one year, those who are blind, and those who are receiving life-sustaining therapy. These non-refundable tax credits are used to reduce the amount that the person owes on federal income tax.
Other tax measures include the Medical Expense Tax Credit, Caregiver Credit, Infirm Dependant Credit, Disability Supports Deduction, and the Refundable Medical Expense Supplement. Some of these tax measures are available to people without disabilities who have qualifying medical expenses.
Registered Disability Savings Plan
The Registered Disability Savings Plan (RDSP) was established in December 2008 and is delivered by the Canada Revenue Agency. Those eligible to open an RDSP are Canadians who are eligible for the Disability Tax Credit and are under 60 years of age. RDSPs are offered by financial institutions. The lifetime contribution limit for an RDSP is $200,000, but there is no annual limit. Contributions are not tax-deductible and are not included in income when paid out of an RDSP. Investment income accumulates tax-free, but is included in the beneficiary's income for tax purposes when paid out of the RDSP. The Federal government pays a matching Canada Disability Savings Grant of up to $3,500 a year on contributions made into the RDSP and a Canada Disability Savings Bond of up to $1,000 a year into the RDSPs of low-income and modest-income Canadians, up to specified maximums.
Summary
The first five disability income systems[12] are work-triggered: they are only available to those who have engaged in regular salaried or wage-paid work. They generally do not provide benefits to those with irregular, minimal, or contract employment, which are features of the world of work for many people with disabilities in Canada. Social assistance disability income is not predicated on workforce attachment. The two tax measures are not work-triggered.
Trends in disability benefit expenditures: Social assistance disability income support is significant, is growing, and, in Ontario and westward, is growing faster than other supports
Our research demonstrates that social assistance disability income program spending represents the largest share of overall disability program expenditures in Canada. In Ontario westward, this share is increasing much more rapidly than it is in the eastern provinces.[13]
Canada
Expenditures on social assistance disability income are significant. In 2010-11, social assistance in Canada for people with disabilities comprised about 27% of disability program expenditures, or an estimated $7.7 billion. The next largest expenditures were Private Disability Insurance at $5.7 billion and Workers' Compensation at $5.4 billion.
Estimated Disability Benefit Expenditures,
Canada 2010-11
$28.6 B
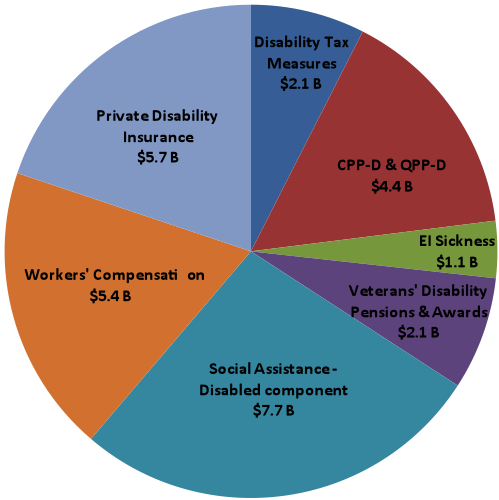
- Disability Tax Measures
- $2.1 B
- Canada Pension Plan/Quebec Pension Plan Disability Benefits
- $4.4 B
- Employment Insurance Sickness Benefits
- $1.1 B
- Veterans' Disability Pensions and Awards
- $2.1 B
- Social Assistance—Disabled Component
- $7.7 B
- Workers' Compensation
- $5.4 B
- Private Disability Insurance
- $5.7 B
Further, spending on social assistance disability programs is growing. In Canada, this spending increased 29.9% from 2005-06 to 2010-11, the largest increase in the seven income disability systems.[14]
Estimated Disability Benefit Expenditures,
Canada 2005-06
$23.2 B (revised)
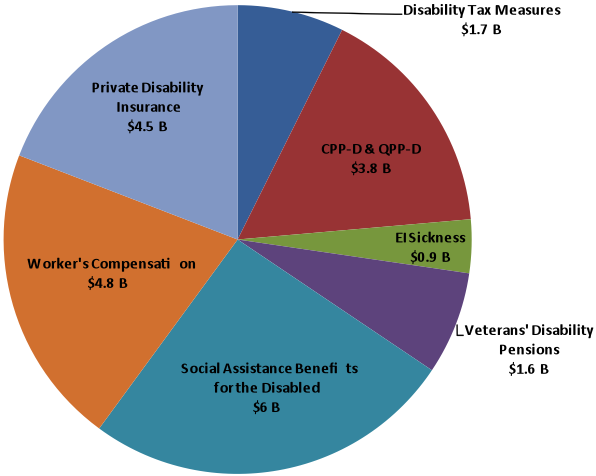
- Disability Tax Measures
- $1.7 B
- Canada Pension Plan/Quebec Pension Plan Disability Benefits
- $3.8 B
- Employment Insurance Sickness Benefits
- $0.9 B
- Veterans' Disability Pensions and Awards
- $1.6 B
- Social Assistance—Disabled Component
- $6.0 B
- Workers' Compensation
- $4.8 B
- Private Disability Insurance
- $4.8 B
Our research shows that the total expenditures on social assistance disability income programs are growing faster than total spending on other programs. They represent an increasingly large slice of the disability income support pie. Social assistance disability programs' share of total disability income program spending rose from 25.6% to 27.1% across Canada between 2005-06 and 2010-11. While spending on social assistance disability programs increased 29.9% during those years, total income support for the disabled excluding social assistance increased only 20.5%.
Income Support for the Disabled:
Percentage Increase from 2005-06 to 2010-11
Canada
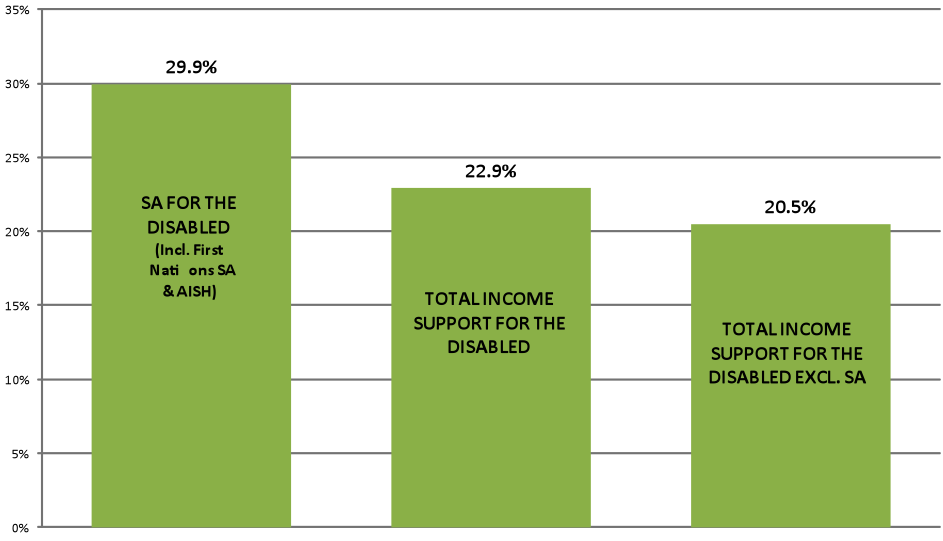
- Social Assistance for the Disabled (includes First Nations Social Assistance and Assured Income for the Severely Handicapped)
- $29.9 B
- Total Income Support for the Disabled
- $22.9 B
- Total Income Support for the Disabled Excluding Social Assistance
- $20.5 B
Ontario and westward
Our research shows regional variation in the growth of social assistance disability program spending relative to the growth of other program spending, with Ontario and provinces westward pushing the trend towards greater reliance on social assistance disability income support.
Percent Change in Social Assistance Spending on the Disabled
Ontario and Western Provinces
2005-06 to 2010-11
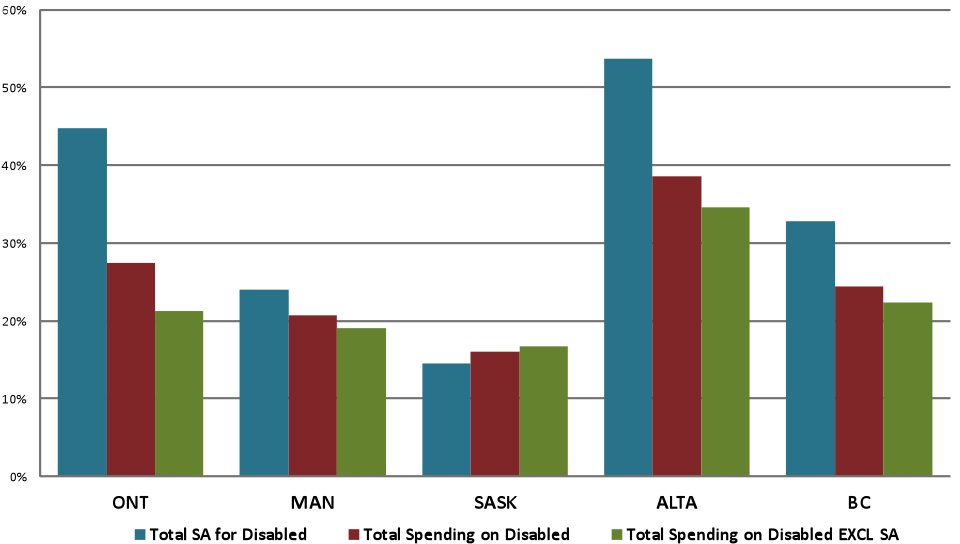
| Total Social Assistance for Disabled | Total Spending on Disabled | Total Spending on Disabled Excluding Social Assistance | |
|---|---|---|---|
| Ontario | 44.8% | 27.4% | 21.2% |
| Manitoba | 24.0% | 20.6% | 19.1% |
| Saskatchewan | 14.5% | 16.1% | 16.7% |
| Alberta | 53.7% | 34.5% | 27.5% |
| British Columbia | 32.8% | 24.5% | 22.3% |
Ontario
Expenditures in Ontario are particularly significant. Ontario has a separate social assistance disability system, the Ontario Disability Support Program (ODSP). It provided $3.5 billion in income support in 2010-11. The First Nations Social Assistance (SA) disabled component provided an additional $68 million. Social assistance spending on the disabled from these two sources combined comprised 30% of total expenditures. Private Disability Insurance followed at $2.5 billion, and Workers' Compensation at $2.3 billion.[15]
ODSP and First Nations SA share of total disability income program spending rose from 26.4% to 30% between 2005-06 and 2010-11. While spending on ODSP and First Nations SA increased 44.8% in the last six years, total income support for the disabled excluding ODSP and First Nations SA increased only 21.2%.
Income Support for the Disabled:
Percentage Increase from 2005-06 to 2010-11
Ontario
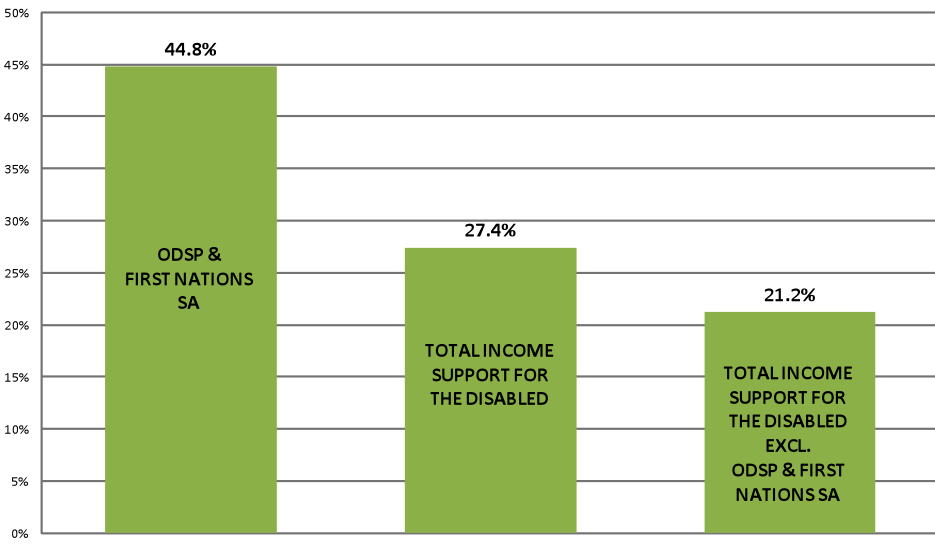
- Ontario Disability Support Program and First Nations Social Assistance
- 44.8%
- Total Income Support for the Disabled
- 27.5%
- Total Income Support for the Disabled Excluding Ontario Disability Support Program and First Nations Social Assistance
- 21.2%
Manitoba
As in Ontario, benefits for the disabled under the Employment and Income Assistance (EIA) program represented the largest slice of the pie in Manitoba, costing $188 million and comprising approximately 21.4% of total expenditures in 2010-11. Social assistance spending overall, including First Nations Social Assistance, amounted to $287.3 million. The next largest expenditures were CPP-D and private disability insurance.
In contrast to Ontario, Manitoba's EIA for the disabled share of total disability income program spending registered a slight decrease from 21.5% to 21.4% between 2005-06 and 2010-11. However, when First Nations SA is factored in, overall spending increased slightly from 31.9% to 32.8% of total spending. Spending on social assistance including First Nations SA increased 24%, while total income support for the disabled excluding social assistance increased 19.1%.
Income Support for the Disabled:
Percentage Increase from 2005-06 to 2010-11
Manitoba
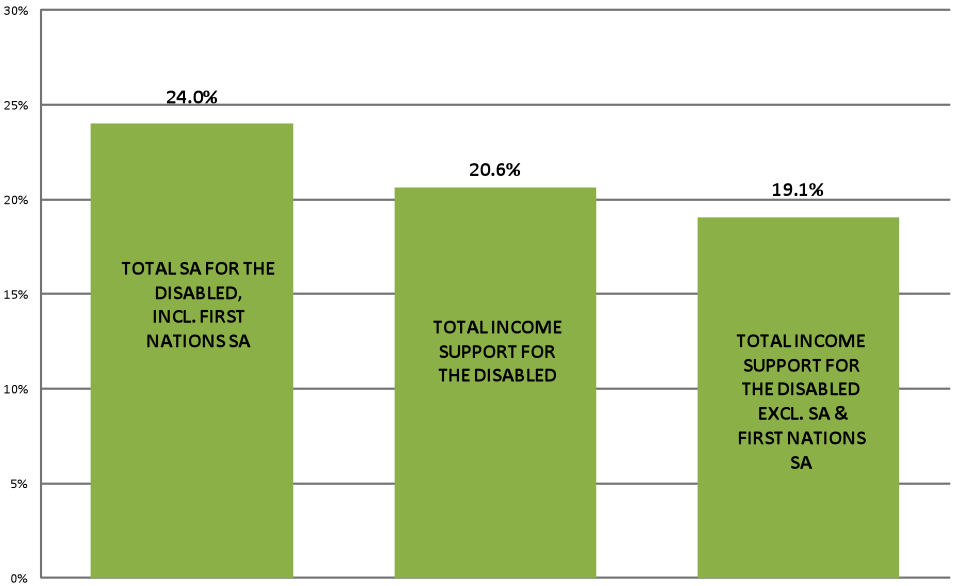
- Total Social Assistance for the Disabled, Including First Nations Social Assistance
- 24.0%
- Total Income Support for the Disabled
- 20.6%
- Total Income Support for the Disabled Excluding Social Assistance and First Nations Social Assistance
- 19.1%
Saskatchewan
Spending for the disabled under the Saskatchewan Assistance Plan (SAP) represented the second largest program expenditure in 2010-11 (an estimated $118.5 million or 17.4% of total expenditures), slightly behind Workers' Compensation. However, spending on First Nations Social Assistance for the disabled cost $77.4 million, representing 11.4% of spending. Combined, SAP for the disabled and First Nations SA for the disabled cost $195.9 million or 28.8% of total spending. The next largest expenditures were Workers' Compensation ($121 million) and Private Disability Insurance ($109 million).
Saskatchewan's SAP benefits for the disabled share of total disability income program spending showed a small decrease from 18.8% in 2005-06 to 17.4% in 2010-11. Spending on social assistance overall—including First Nations Social Assistance for the disabled—decreased from 29.2% to 28.8% of total spending in those six years. Spending on social assistance overall increased 14.5%, while total income support for the disabled excluding social assistance increased 16.7%.[16]
Income Support for the Disabled:
Percentage Increase from 2005-06 to 2010-11
Saskatchewan
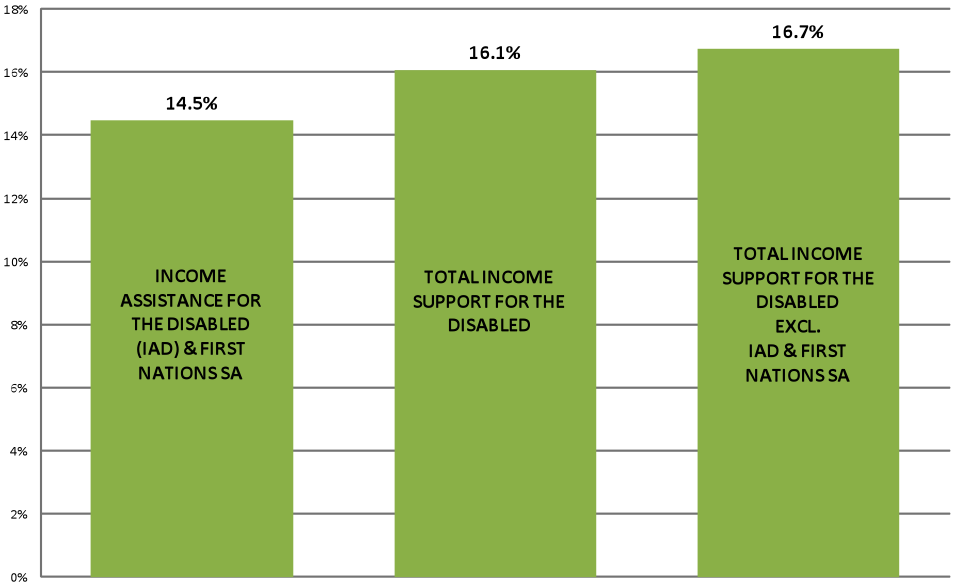
- Income Assistance for the Disabled and First Nations Social Assistance
- 14.5%
- Total Income Support for the Disabled
- 16.1%
- Total Income Support for the Disabled Excluding Income Assistance for the Disabled and First Nations Social Assistance
- 16.7%
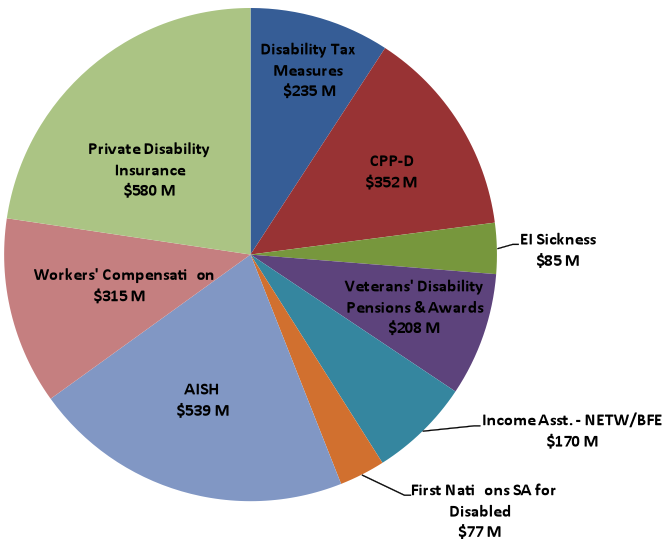
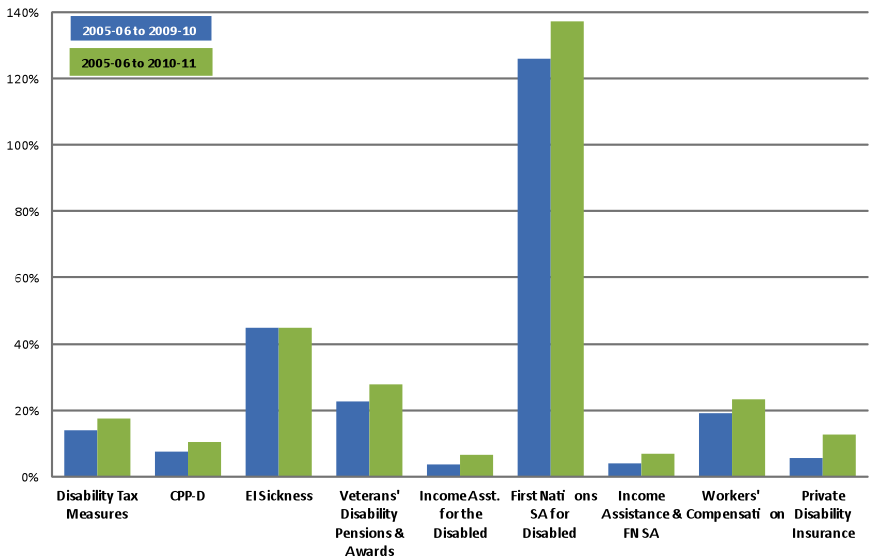
Alberta
Spending on the "Barriers to Full Employment (BFE)" component of Alberta's Income Support Program represented a relatively small program expenditure in 2010-11 ($170 million or 6.6% of total expenditures). Spending on First Nations Social Assistance for the disabled cost $76.8 million, representing 3% of spending.
In Alberta, the primary income support program for adults with a severe and permanent disability that substantially limits their ability to earn a livelihood is the Assured Income for the Severely Handicapped (AISH) program. Unlike other provincial disability benefits which adjust for family size, AISH provides a flat rate benefit. In 2010-11 AISH spending amounted to $539.1 million or 21.1% of total spending.[17] Combined, Income Support's BFE assistance, First Nations Social Assistance for the disabled and AISH amounted to $785.9 million or 30.7% of total spending. This amount was followed by Private Disability Insurance and CPP-D.
Alberta's Income Support Program, BFE assistance share of total disability income program spending showed a small increase from 5.9% in 2005-06 to 6.6% in 2010-11. Spending on social assistance overall—including First Nations Social Assistance for the disabled and AISH—increased from 26.9% to 30.7% of total expenditures in those six years. Spending on social assistance overall increased 53.7%, while total income support for the disabled excluding social assistance increased 27.5%.
Income Support for the Disabled:
Percentage Increase from 2005-06 to 2010-11
Alberta
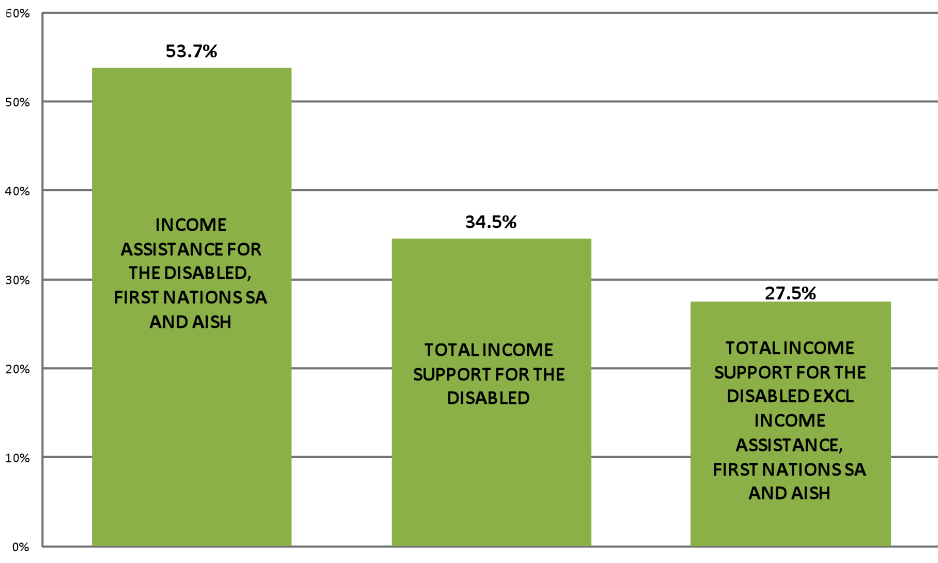
- Income Assistance for the Disabled, First Nations Social Assistance and Assured Income for the Severely Handicapped
- 53.7%
- Total Income Support for the Disabled
- 34.5%
- Total Income Support for the Disabled Excluding Income Assistance, First Nations Social Assistance and Assured Income for the Severely Handicapped
- 27.5%
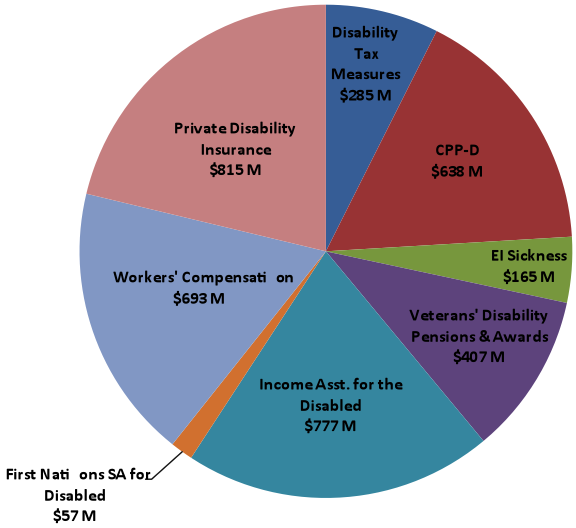
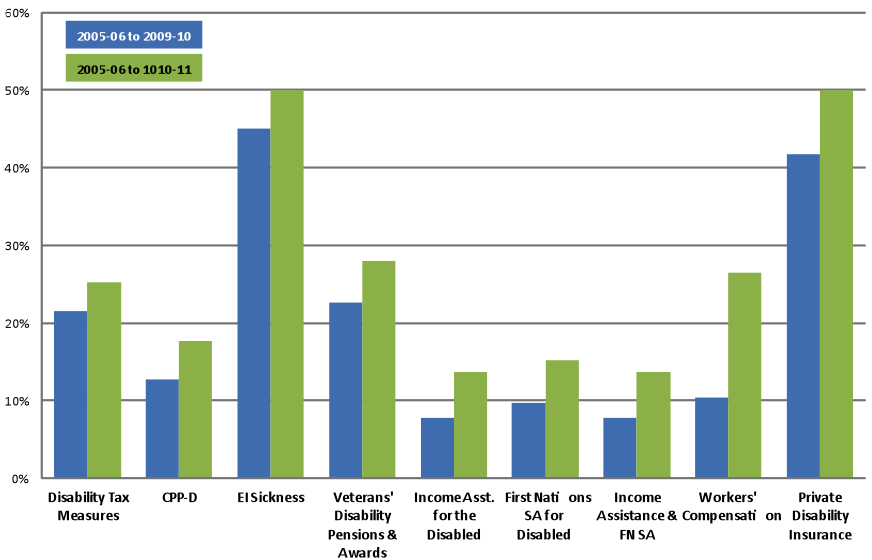
British Columbia
Like Ontario, British Columbia has a separate social assistance disability income support program: Income Assistance for the Disabled. Unlike in Ontario and Manitoba, spending on this program ($777.1 million or 20.3% of total expenditures) was eclipsed by Private Disability Insurance ($815 million) in 2010-11.
British Columbia's Income Assistance for the Disabled program's share of total disability income program spending showed an increase from 18.7% in 2005-06 to 20.3% in 2010-11. Spending on First Nations Social Assistance for the disabled cost $57.1 million, representing 1.5% of spending. Combined, Income Assistance for the Disabled and First Nations Social Assistance for the disabled cost $834.2 million or 21.7% of total spending. Spending on social assistance increased 32.8%, while total income support for the disabled excluding social assistance increased 22.3%.
Income Support for the Disabled:
Percentage Increase from 2005-06 to 2010-11
British Columbia
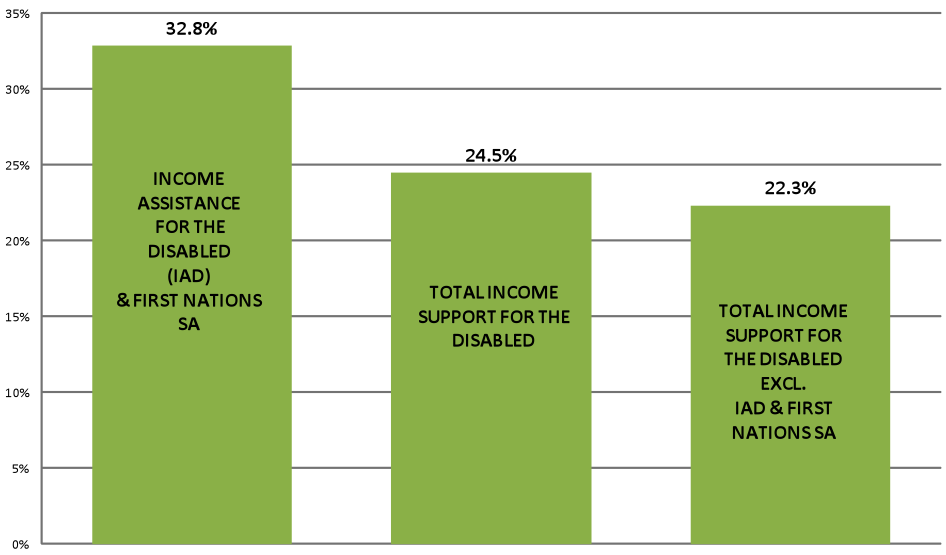
- Income Assistance for the Disabled and First Nations Social Assistance
- 32.8%
- Total Income Support for the Disabled
- 24.5%
- Total Income Support for the Disabled Excluding Income Assistance for the Disabled and First Nations Social Assistance
- 22.3%
Quebec and eastward
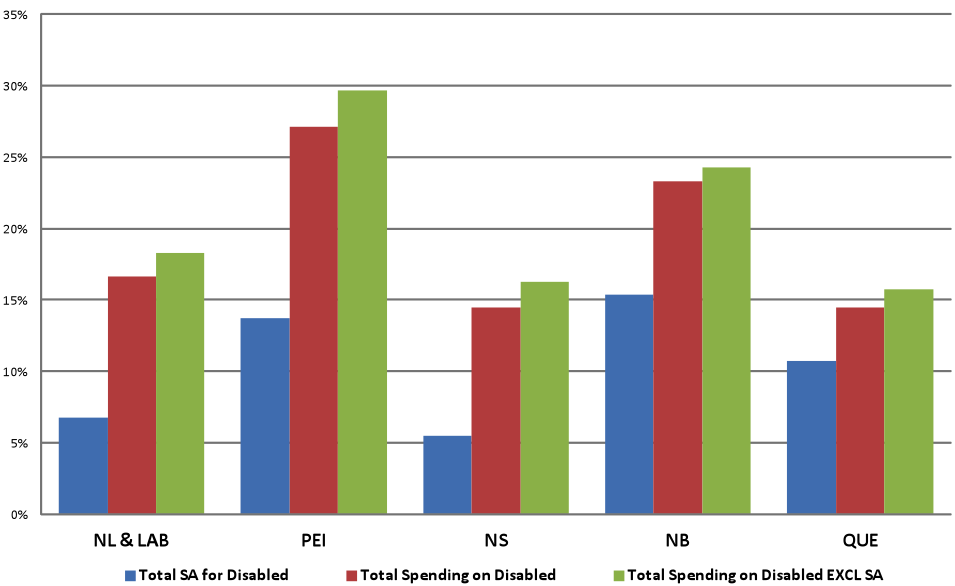
The trend toward greater reliance on social assistance disability income support does not hold in Quebec and the four Atlantic provinces. In all of these provinces, social assistance's share of total disability income program spending is actually decreasing.
Percent Change in Social Assistance Spending on the Disabled
Eastern Provinces and Quebec
2005-06 to 2010-11
| Total Social Assistance for the Disabled | Total Spending on the Disabled | Total Spending on the Disabled Excluding Social Assistance | |
|---|---|---|---|
| Newfoundland and Labrador | 6.7% | 16.6% | 18.3% |
| Prince Edward Island | 13.7% | 27.1% | 29.6% |
| Nova Scotia | 5.5% | 14.5% | 16.3% |
| New Brunswick | 15.4% | 23.3% | 24.2% |
| Quebec | 10.7% | 14.5% | 15.7% |
Quebec
Quebec's Social Solidarity Program cost an estimated $1.3 billion, or 22.6% of total spending in 2010-11. Spending on First Nations Social Assistance for the disabled cost $35.5 million, representing 0.6% of spending. Combined, the Social Solidarity Program and First Nations Social Assistance for the disabled cost $1.3 billion or 23.3% of total spending. Spending on Workers' Compensation was slightly higher ($1.3 billion or 23.5%), and Private Disability Insurance was slightly lower ($1.3 billion or 21.8%).
Quebec's Social Solidarity Program's share of total disability income program spending showed a decrease from 23.5% in 2005-06 to 22.6% in 2010-11. Spending on social assistance overall—including First Nations Social Assistance for the disabled—decreased from 24.1% to 23.3% of total spending in those six years. Spending on social assistance overall increased only 10.7%, while total income support for the disabled excluding social assistance increased 15.7%.
Income Support for the Disabled:
Percentage Increase from 2005-06 to 2010-11
Quebec
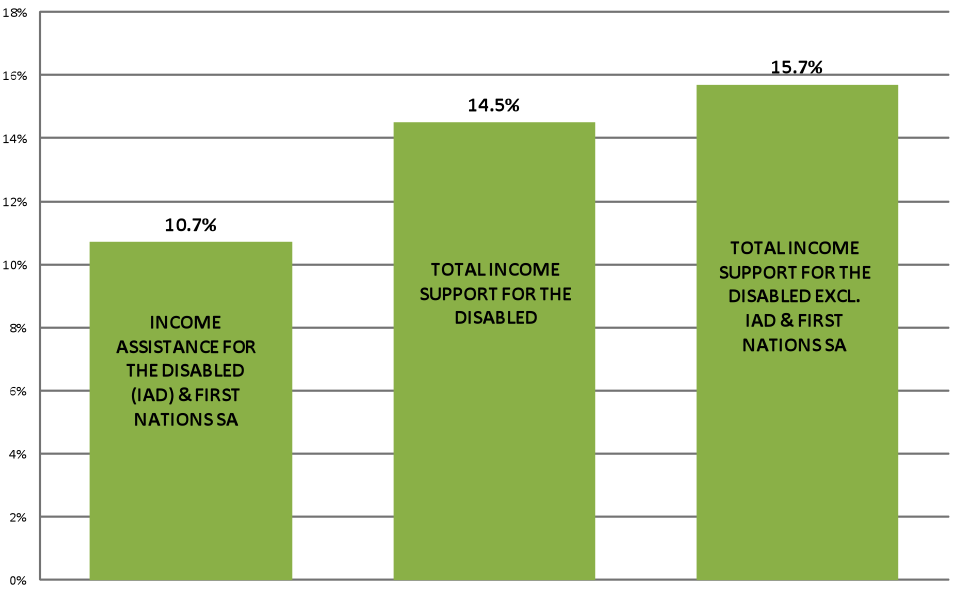
- Income Assistance for the Disabled and First Nations Social Assistance
- 10.7%
- Total Income Support for the Disabled
- 14.5%
- Total Income Support for the Disabled Excluding Income Assistance for the Disabled and First Nations Social Assistance
- 15.7%
New Brunswick
In 2010-11, New Brunswick's Extended Benefits Program cost $42.3 million, or 6.7% of total spending. Spending on First Nations Social Assistance for the disabled cost $21.4 million, representing 3.4% of spending. Combined, the Extended Benefits Program and First Nations Social Assistance for the disabled cost $63.7 million or 10.1% of total spending. With the exceptions of Disability Tax Measures and EI Sickness, spending on each other program was higher. The biggest slice of the pie was CPP-D spending ($157.9 million or 24.9%).
New Brunswick's Extended Benefits Program's share of total disability income program spending showed a decrease from 7.4% in 2005-06 to 6.7% in 2010-11. Spending on social assistance overall—including First Nations Social Assistance for the disabled—decreased from 10.7% to 10.1% of total spending in those six years. Spending on social assistance overall increased only 15.4%, while total income support for the disabled excluding social assistance increased 24.2%.
Income Support for the Disabled:
Percentage Increase from 2005-06 to 2010-11
New Brunswick
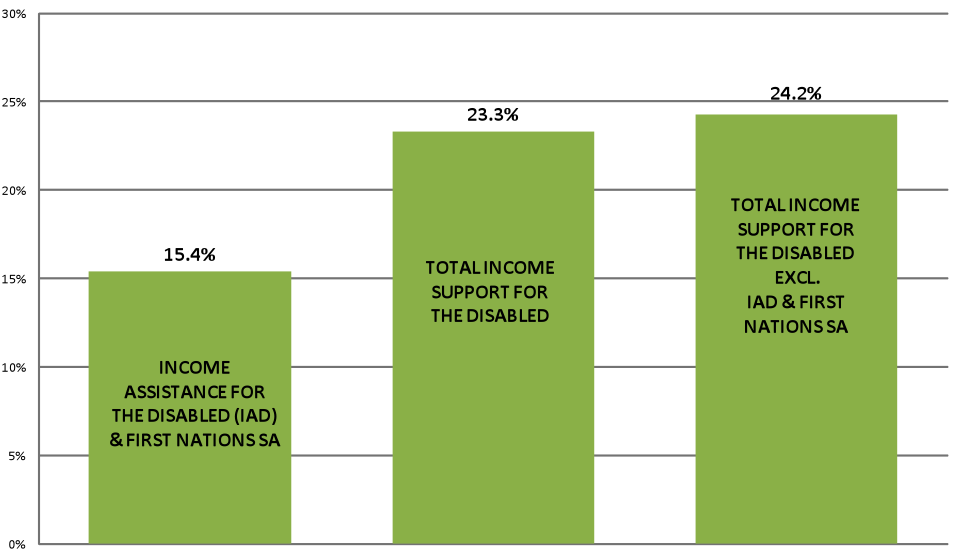
- Income Assistance for the Disabled and First Nations Social Assistance
- 15.4%
- Total Income Support for the Disabled
- 23.3%
- Total Income Support for the Disabled Excluding Income Assistance for the Disabled and First Nations Social Assistance
- 24.2%
Prince Edward Island
In Prince Edward Island, spending on the disabled under its Social Assistance program cost an estimated $16.9 million, or 13.7% of total spending in 2010-11. Spending on First Nations Social Assistance for the disabled cost $0.6 million, representing 0.4% of spending. Combined, Social Assistance for the disabled and First Nations SA for the disabled cost $17.5 million or 14.2% of total spending. The largest program expenditures were CPP-D ($30.6 million or 24.8%) and Veterans' Disability Pensions and Awards ($23.3 million or 18.9%).
Prince Edward Island's Social Assistance program's share of total disability income program spending showed a decrease from 15.4% in 2005-06 to 13.7% in 2010-11. Spending on social assistance overall—including First Nations Social Assistance for the disabled—decreased from 15.9% to 14.2% of total spending over that time. Spending on social assistance overall increased only 13.7%, while total income support for the disabled excluding social assistance increased 29.6%.
Income Support for the Disabled:
Percentage Increase from 2005-06 to 2010-11
Prince Edward Island
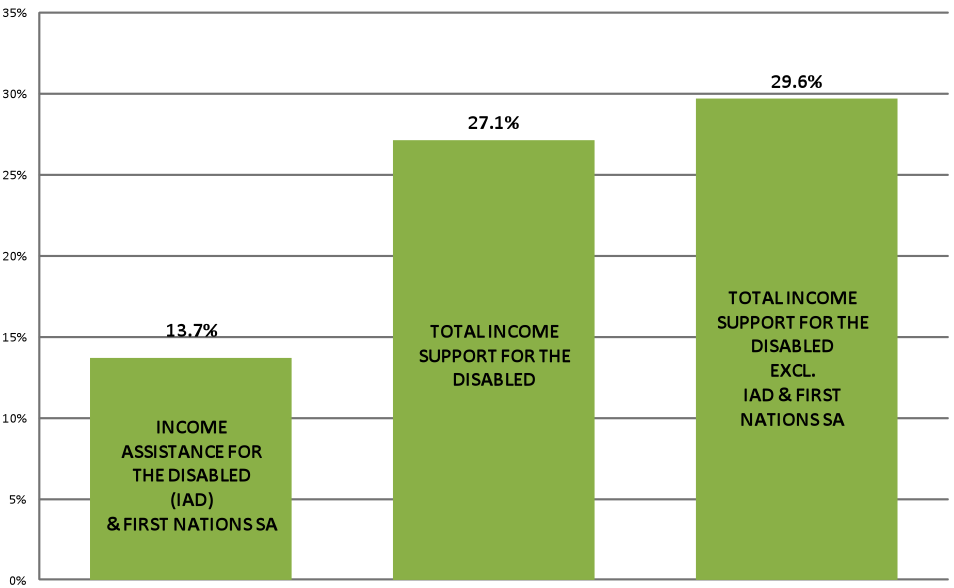
- Income Assistance for the Disabled and First Nations Social Assistance
- 13.7%
- Total Income Support for the Disabled
- 27.1%
- Total Income Support for the Disabled Excluding Income Assistance for the Disabled and First Nations Social Assistance
- 29.6%
Nova Scotia
Nova Scotia's Employment Support and Income Assistance program benefits for the disabled spent an estimated $127.4 million or 13.5% of total spending in 2010-11. Spending on First Nations Social Assistance for the disabled cost $18.9 million, accounting for 2% of spending. Combined, Employment Support and Income Assistance program benefits for the disabled and First Nations Social Assistance for the disabled cost $146.4 million or 15.5% of total spending. Three program expenditures were larger: CPP-D ($255.7 million or 27.2%), Veterans Disability Pensions and Awards ($158.9 million or 16.9%) and Workers' Compensation ($148.9 million or 15.8%).
Nova Scotia's Employment Support and Income Assistance program benefits for the disabled share of total disability income program spending decreased from 14.5% in 2005-06 to 13.5% in 2010-11. Spending on social assistance overall—including First Nations Social Assistance for the disabled—decreased from 16.9% to 15.5% of total spending over that time. Spending on social assistance overall increased only 5.5%, while total income support for the disabled excluding social assistance increased 16.3%.
Income Support for the Disabled:
Percentage Increase from 2005-06 to 2010-11
Nova Scotia
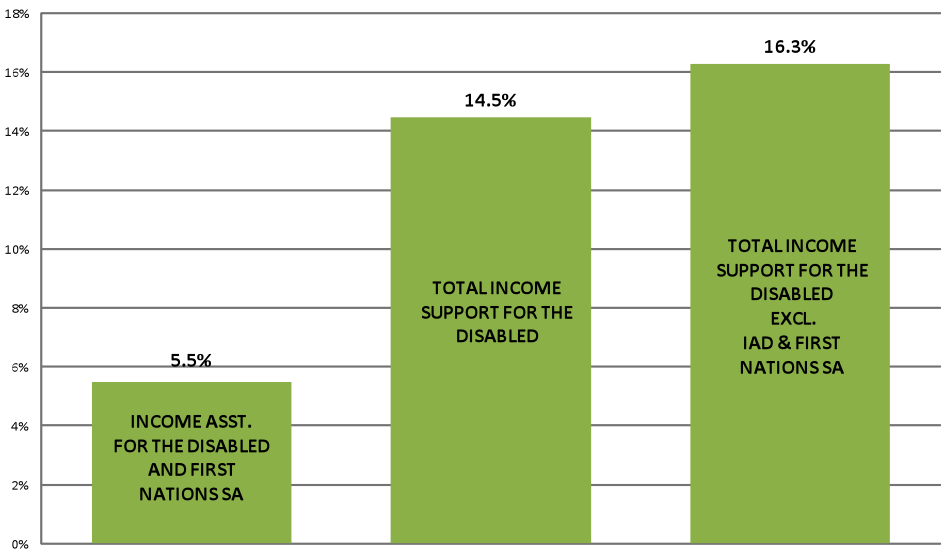
- Income Assistance for the Disabled and First Nations Social Assistance
- 5.5%
- Total Income Support for the Disabled
- 14.5%
- Total Income Support for the Disabled Excluding Income Assistance for the Disabled and First Nations Social Assistance
- 16.3%
Newfoundland and Labrador
In 2010-11, benefits for the disabled under Newfoundland and Labrador's Income Support program cost an estimated $55.8 million, or 13% of total spending. Spending on First Nations Social Assistance for the disabled cost $0.3 million, representing only 0.1% of spending. Combined, Income Support for the disabled and First Nations Social Assistance for the disabled cost $56.1 million or 13% of total spending. Programs with higher expenditures were CPP-D ($122.3 million or 28.4%), Workers' Compensation ($90.8 million or 21.1%) and Private Disability Insurance ($62 million or 14.4%).
Newfoundland and Labrador's Income Support program for the disabled program's share of total disability income program spending showed a decrease from 14.2% in 2005-06 to 13% in 2010-11. Spending on social assistance overall—including First Nations Social Assistance for the disabled—decreased from 14.2% to 13% of total spending during those years. Spending on social assistance overall increased only 6.7%, while total income support for the disabled excluding social assistance increased 18.3%.
Income Support for the Disabled:
Percentage Increase from 2005-06 to 2010-11
Newfoundland and Labrador
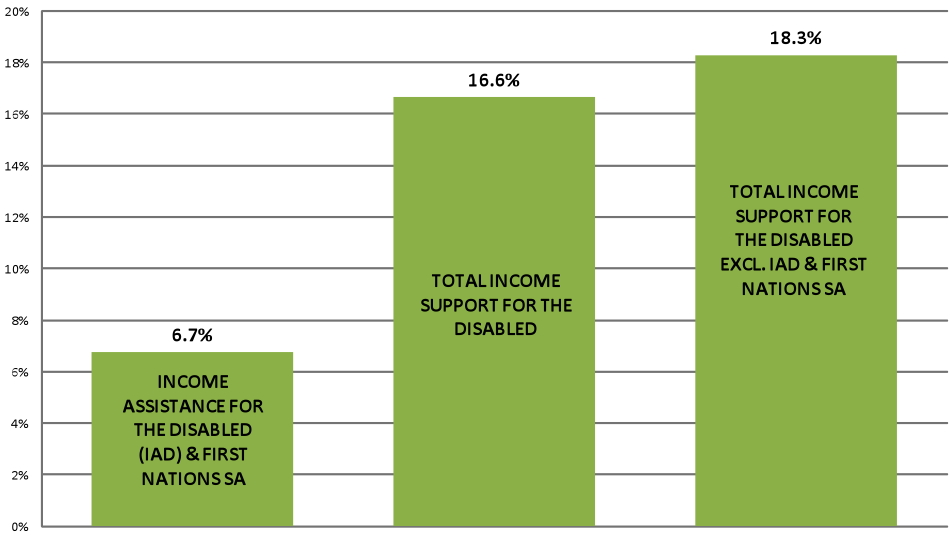
- Income Assistance for the Disabled and First Nations Social Assistance
- 6.7%
- Total Income Support for the Disabled
- 16.6%
- Total Income Support for the Disabled Excluding Income Assistance for the Disabled and First Nations Social Assistance
- 18.3%
Observations and areas for future research
The following section summarizes our observations based on the data and presents possible areas for further research. If this apparent drift to social assistance as the dominant income system for people with disabilities continues, it may have serious consequences for beneficiaries of the various income support systems and for the governments providing these benefits. More research is required to understand these consequences.
Disability culture
The notion of "disability culture" posits that individuals will choose to access social assistance disability benefits over retaining work or accessing other benefits. It is a theory that assumes that recipients will use disability income as a way of avoiding work and governments will use it as a way of reducing unemployment statistics.
Further research is necessary to investigate these choices: Are individuals choosing not to work and marshalling existing impediments in such a way as to obtain disability benefits? Are individuals who do not believe they have a reasonable opportunity to work marshalling these impediments in this way because, in some provinces, disability benefits are greater than regular social assistance benefits?
The role of Employment Insurance, CPP-D, and Veterans' benefits
There are significant differences between EI CPP-D and Veterans' payments Quebec eastward versus Ontario westward. In our previous research,[18] we demonstrated that the effects of the recession of 2008-09 on social assistance cases were markedly different between Quebec eastward and Ontario westward. Caseloads in the Eastern provinces had returned to pre-recession levels, but were up an average of 23% in Ontario westward. Since this same trend (Ontario west, Quebec east differences) are replicated for social assistance disability expenditures, it may be that regular EI availability (in addition to EI sickness benefits), CPP-D and Veterans' benefits play an important role in reducing the welfareization of disability benefits in Eastern Canada.
E1 Palyment Per Capita, by Province and for Canada, 2009 and 2010
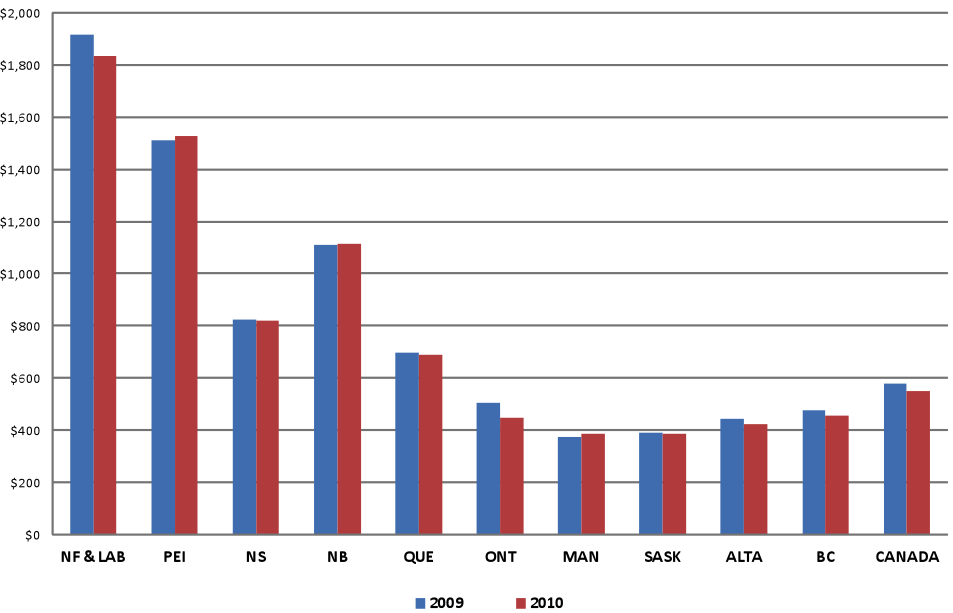
| 2009 | 2010 | |
|---|---|---|
| Newfoundland and Labrador | $1,917 | $1,835 |
| Prince Edward Island | $1,509 | $1,529 |
| Nova Scotia | $822 | $819 |
| New Brunswick | $1,112 | $1,113 |
| Quebec | $698 | $689 |
| Ontario | $506 | $448 |
| Manitoba | $375 | $386 |
| Saskatchewan | $389 | $385 |
| Alberta | $445 | $423 |
| British Columbia | $478 | $457 |
| Canada | $580 | $549 |
EI Sickness per capita, 2005 and 2010
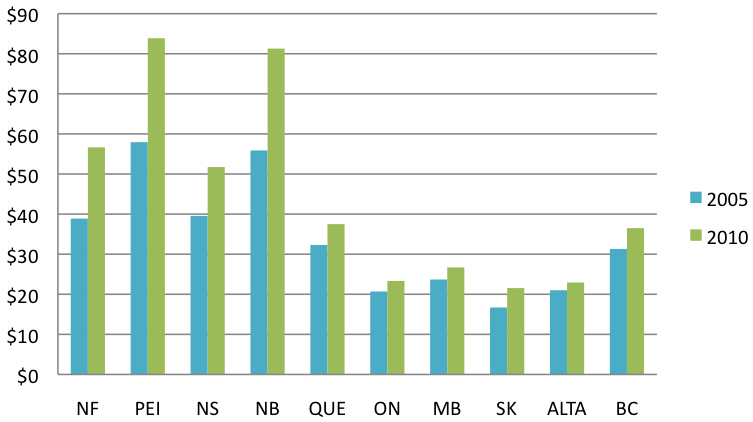
| 2005 | 2010 | |
|---|---|---|
| Newfoundland and Labrador | $38.33 | $56.65 |
| Prince Edward Island | $57.95 | $83.87 |
| Nova Scotia | $39.55 | $51.75 |
| New Brunswick | $55.85 | $81.29 |
| Quebec | $32.30 | $37.51 |
| Ontario | $20.70 | $23.33 |
| Manitoba | $23.68 | $26.71 |
| Saskatchewan | $16.71 | $21.54 |
| Alberta | $21.01 | $22.95 |
| British Columbia | $31.31 | $36.49 |
CPP disability, per capita, 2005 and 2010
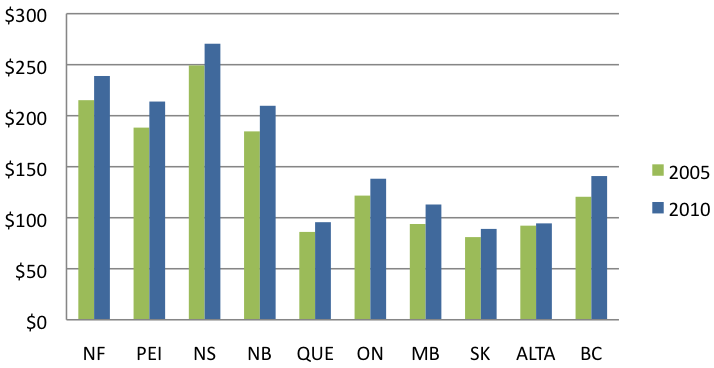
| 2005 | 2010 | |
|---|---|---|
| Newfoundland and Labrador | $215.22 | $238.93 |
| Prince Edward Island | $188.33 | $213.87 |
| Nova Scotia | $249.27 | $270.54 |
| New Brunswick | $184.64 | $209.75 |
| Quebec | $86.10 | $95.63 |
| Ontario | $121.69 | $138.23 |
| Manitoba | $93.86 | $112.97 |
| Saskatchewan | $81.02 | $89.05 |
| Alberta | $92.23 | $94.47 |
| British Columbia | $120.54 | $140.85 |
Veterans' Pensions and Awards, per capita, 2005 and 2020
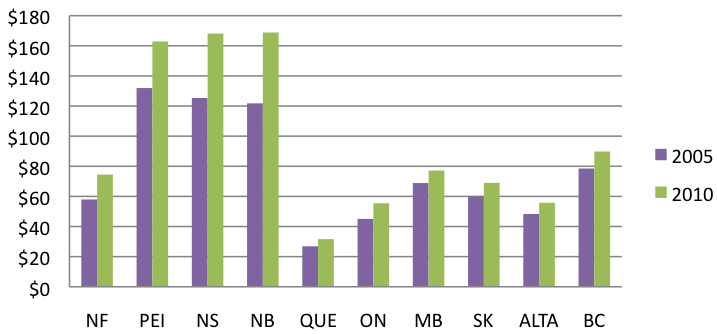
| 2005 | 2010 | |
|---|---|---|
| Newfoundland and Labrador | $57.95 | $74.50 |
| Prince Edward Island | $131.95 | $162.87 |
| Nova Scotia | $125.36 | $168.11 |
| New Brunswick | $121.77 | $168.83 |
| Quebec | $26.86 | $31.62 |
| Ontario | $45.07 | $55.43 |
| Manitoba | $68.87 | $77.15 |
| Saskatchewan | $60.00 | $68.97 |
| Alberta | $48.34 | $55.75 |
| British Columbia | $78.52 | $89.80 |
First Nations representation
The larger presence of First Nations people in western Canada has had a significant impact on overall social assistance disability spending there. In 2006, Ontario and the four Western provinces had the largest Aboriginal populations. The provinces with the highest proportion of Aboriginal populations were Manitoba (15.5%) and Saskatchewan (14.9%).[19] In 2010-11, First Nations Social Assistance for the Disabled accounted for 11.4% of total spending in both Manitoba and Saskatchewan. By contrast, in New Brunswick, the spending on First Nations Social Assistance for the Disabled amounted to 3.4% of spending in 2010-11, and this was the highest of any of the Eastern provinces.
Changes to other disability income systems
One important line of inquiry is to examine changes to work-triggered disability income programs. Are people with disabilities who should be supported by work-triggered disability income programs either exhausting the benefits available through these programs or finding themselves ineligible for these benefits, leaving social assistance programs to pick up the slack?
Separate disability programs
The programs in Ontario, Alberta and British Columbia have their own separate legislation and regulations. In all other provinces, benefits for the disabled are provided through the existing social assistance legislation.[20] These three provinces showed the greatest overall increase in social assistance disability spending. Do separate social assistance disability programs and the corresponding higher benefit levels have a bearing on higher program usage?
Social assistance supports for employment
Social assistance permits a recipient to work and receive benefits. Unlike work-triggered programs, there is no automatic cut-off when a recipient engages in paid employment. In addition, social assistance benefits are statutory and not time limited (except for ending when the recipient reaches 65), and they often come with good ancillary benefits. Social assistance programs also frequently provide rapid reinstatement for people with disabilities who try, and fail, to exit. This may provide recipients with a sense of "security".
Demographics of recipients of social assistance disability benefits
It would be illuminating to study in detail the demographics of recipients of benefits. What are the demographics of those benefiting from social assistance disability income programs versus those benefiting from work-triggered programs? Are they accessing multiple benefits and if so, how does this affect total income support received?
Lack of knowledge
To what extent are regularly-employed individuals with disabilities aware that they are eligible for work-triggered supports? They may turn to social assistance as a more familiar form of income support.
Additional research is required to understand the interplay between economic conditions, workplace injury, and access to work-triggered supports.
Labour force
How and to what extent are people with disabilities participating in the labour force? How and to what extent are they engaged in non-traditional work, making them ineligible for work-triggered supports? Statistic Canada's Participation and Activity Limitation Survey provides some data about labour force participation:
According to the Participation and Activity Limitation Survey (Statistics Canada, 2008b), 2,457,350 persons with disabilities between the ages of 15 and 64 could have participated in the labour force. Of this group, 51.3% were employed, 43.9% were not in the labour force, and 4.9% were unemployed. In contrast, among those without disabilities, 75.0% were employed, 20.0% were not in the labour force, and 5.0% were unemployed.
The unemployment rate was 10.4% for persons with disabilities, compared to 6.8% for the population without disabilities.[21]
Additional research should examine the experience of people with disabilities with non-traditional employment.
Conclusion
In this paper, we have examined whether work-triggered disability income support expenditures are increasing at the same rate as social assistance disability program expenditures. We have analysed how these trends vary among provinces. In provinces where social assistance disability program expenditures are growing faster than other disability income supports, we have considered some of the drivers of this trend.
As our research demonstrates, social assistance disability program expenditures are increasing faster than work-triggered program expenditures. Social assistance spending comprises a large, and growing, piece of the disability income support pie. Ontario and the Western provinces drive this trend.
We have posed a number of questions for further research into the possible causes of this trend. Ultimately, it is our hope that future research will enable us to understand the causes and consequences of what we have called the "welfareization of disability" and to enable policy-makers to provide more effective, robust, and humane support to Canadians with disabilities.
Angelica and Bob: Postscript[22]
We return now to Angelica and Bob, the two composites that so vividly illustrate what we might call the external influences on disability income programs in Ontario and Canada. Angelica's situation shows that changes in the workplace have resulted in the withdrawal of income and other protections. Instead of receiving support from workplace programs, the Angelicas of the world now have to resort to social assistance to make ends meet. Less than a generation ago, Angelica would not have required social assistance at all. By contrast, Bob exemplifies the changes that have enabled us to diagnose disabilities that may not have been considered as such just a few short years ago.
What the two stories share is that each results in receipt of social assistance disability income benefits that would not have been paid a short generation earlier. The overarching point is that both Angelica and Bob now receive ODSP without any internal changes to ODSP itself. The lesson for policymakers is that any impulse to change program rules in order to bring caseloads down may not have the desired effect, since the reasons that Angelica and Bob now receive ODSP has nothing to do with those rules.
Annex 1: Provincial Data by Program, 2010-11
Estimated Disability Benefit Expenditures
Newfoundland and Labrador 2010-11
$431 M
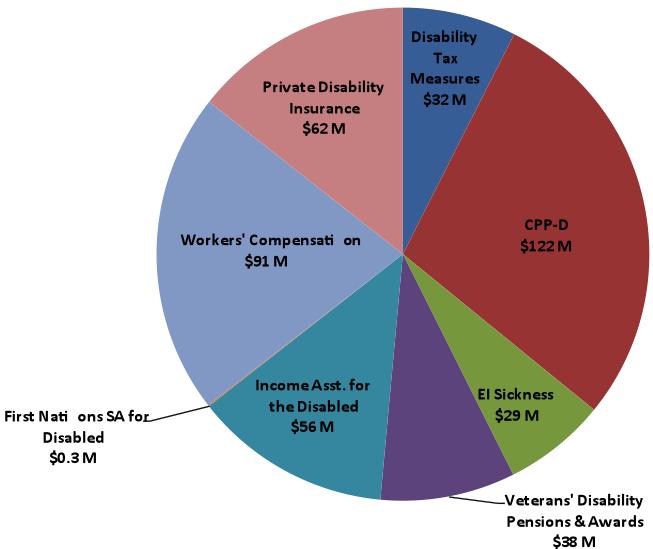
- Disability Tax Measures
- $32 M
- Canada Pension Plan Disabled
- $122 M
- Employment Insurance Sickness Benefits
- $29 M
- Veterans' Disability Pensions and Awards
- $38 M
- Income Assistance for the Disabled
- $56 M
- First Nations Social Assistance for the Disabled
- $0.3 M
- Workers' Compensation
- $91 M
- Private Disability Insurance
- $62 M
Estimated Disability Benefit Expenditures
Prince Edward Island 2010-11
$123 M
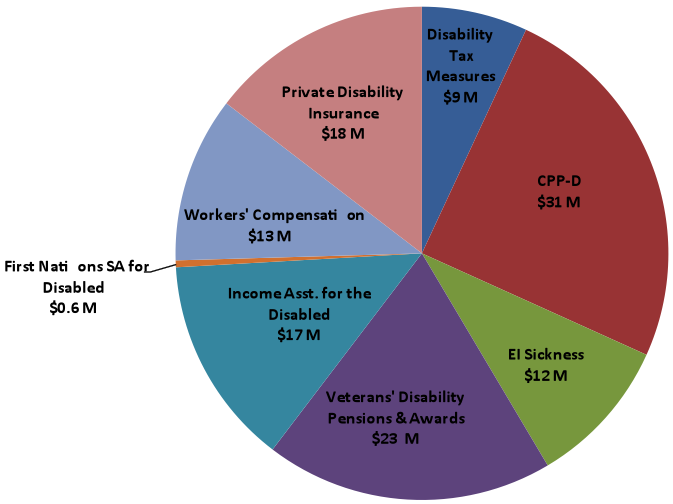
- Disability Tax Measures
- $9 M
- Canada Pension Plan Disabled
- $31 M
- Employment Insurance Sickness Benefits
- $12 M
- Veterans' Disability Pensions and Awards
- $23 M
- Income Assistance for the Disabled
- $17 M
- First Nations Social Assistance for the Disabled
- $0.6 M
- Workers' Compensation
- $13 M
- Private Disability Insurance
- $18 M
Estimated Disability Benefit Expenditures
Nova Scotia 2010-11
$942 M
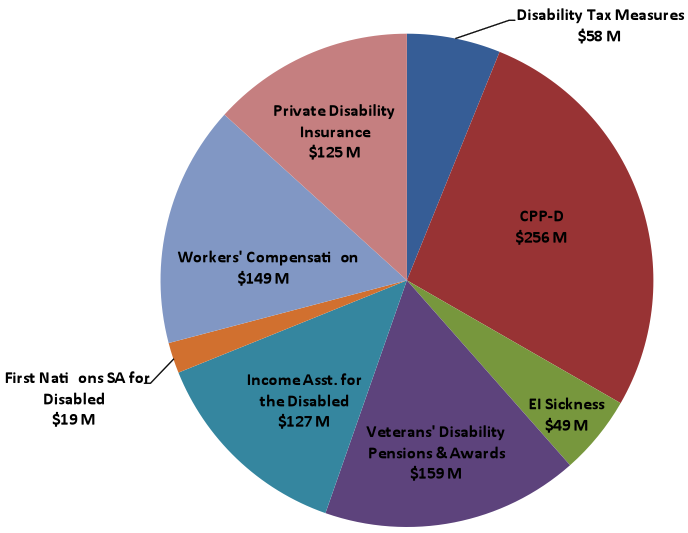
- Disability Tax Measures
- $58 M
- Canada Pension Plan Disabled
- $256 M
- Employment Insurance Sickness Benefits
- $49 M
- Veterans' Disability Pensions and Awards
- $159 M
- Income Assistance for the Disabled
- $127 M
- First Nations Social Assistance for the Disabled
- $19 M
- Workers' Compensation
- $149 M
- Private Disability Insurance
- $125 M
Estimated Disability Benefit Expenditures
New Brunswick 2010-11
$645 M
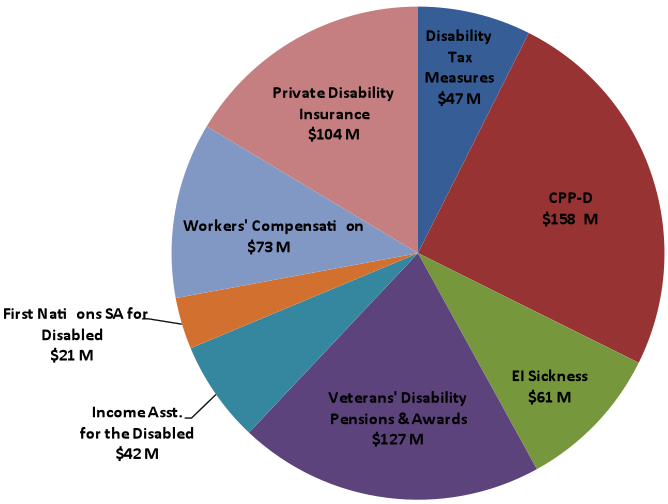
- Disability Tax Measures
- $47 M
- Canada Pension Plan Disabled
- $158 M
- Employment Insurance Sickness Benefits
- $61 M
- Veterans' Disability Pensions and Awards
- $127 M
- Income Assistance for the Disabled
- $42 M
- First Nations Social Assistance for the Disabled
- $21 M
- Workers' Compensation
- $73 M
- Private Disability Insurance
- $104 M
Estimated Disability Benefit Expenditures
Quebec 2010-11
$5.8 B
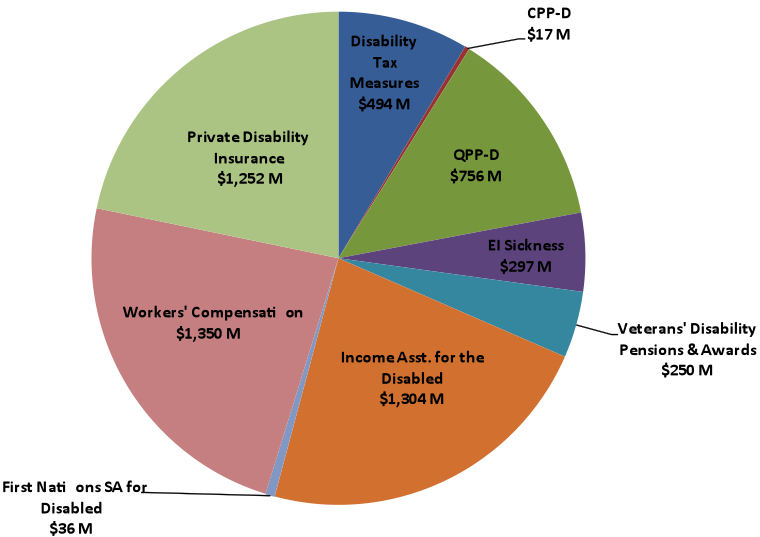
- Disability Tax Measures
- $494 M
- Canada Pension Plan Disabled
- $17 M
- Quebec Pension Plan Disability Benefits
- $756 M
- Employment Insurance Sickness Benefits
- $756 M
- Veterans' Disability Pensions and Awards
- $250 M
- Income Assistance for the Disabled
- $1,304 M
- First Nations Social Assistance for the Disabled
- $36 M
- Workers' Compensation
- $1,340 M
- Private Disability Insurance
- $1,252 M
Estimated Disability Benefit Expenditures
Ontario 2010-11
$12 B
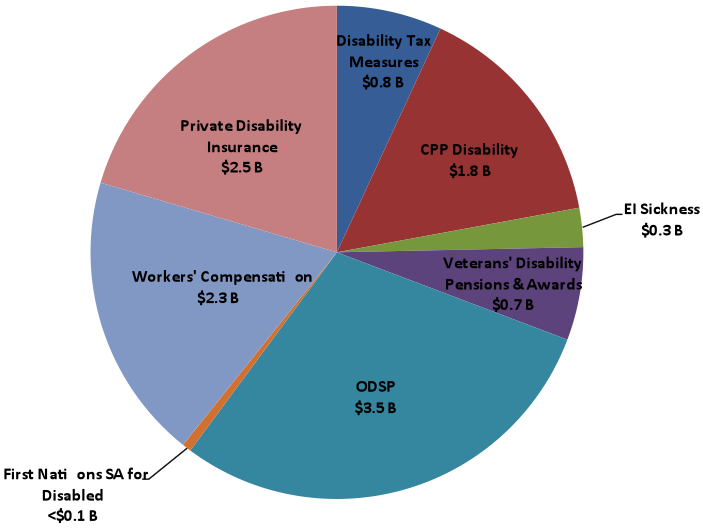
- Disability Tax Measures
- $0.8 B
- Canada Pension Plan Disabled
- $1.8 B
- Employment Insurance Sickness Benefits
- $0.3 B
- Veterans' Disability Pensions and Awards
- $0.7 B
- Ontario Disability Support Program
- $3.5 B
- First Nations Social Assistance for the Disabled
- <$0.1 B
- Workers' Compensation
- $2.3 B
- Private Disability Insurance
- $2.5 B
Estimated Disability Benefit Expenditures
Manitoba 2010-11
$876 M
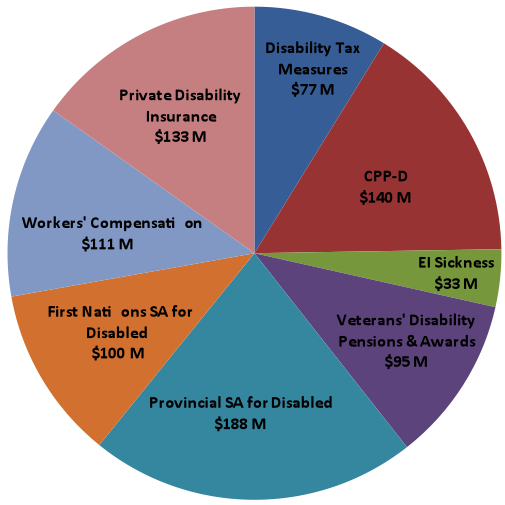
- Disability Tax Measures
- $77 M
- Canada Pension Plan Disabled
- $140 M
- Employment Insurance Sickness Benefits
- $33 M
- Veterans' Disability Pensions and Awards
- $95 M
- Provincial Social Assistance for the Disabled
- $188 M
- First Nations Social Assistance for the Disabled
- <$100 M
- Workers' Compensation
- $111 M
- Private Disability Insurance
- $133 M
Estimated Disability Benefit Expenditures
Saskatchewan 2010-11
$680 M
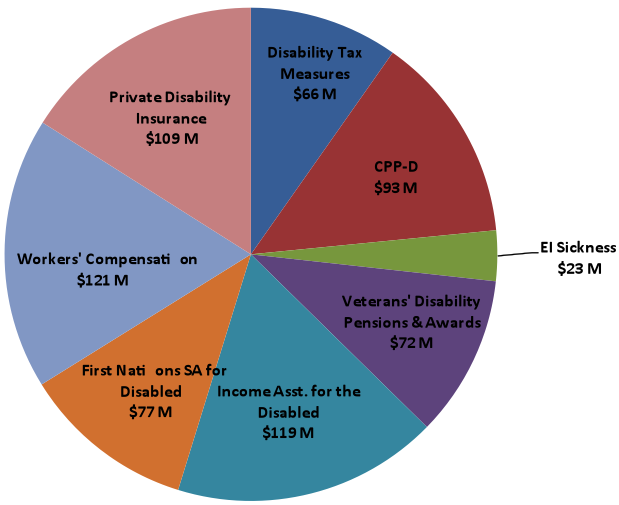
- Disability Tax Measures
- $66 M
- Canada Pension Plan Disabled
- $93 M
- Employment Insurance Sickness Benefits
- $23 M
- Veterans' Disability Pensions and Awards
- $72 M
- Income Assistance for the Disabled
- $119 M
- First Nations Social Assistance for the Disabled
- $77 M
- Workers' Compensation
- $121 M
- Private Disability Insurance
- $109 M
Estimated Disability Benefit Expenditures
Alberta 2010-11
$2.6 B
- Disability Tax Measures
- $235 M
- Canada Pension Plan Disabled
- $352 M
- Employment Insurance Sickness Benefits
- $85 M
- Veterans' Disability Pensions and Awards
- $208 M
- Income Assistance - NETW/BFE
- $170 M
- First Nations Social Assistance for the Disabled
- $77 M
- Assured Income for the Severely Handicapped
- $539 M
- Workers' Compensation
- $315 M
- Private Disability Insurance
- $580 M
Estimated Disability Benefit Expenditures
British Columbia 2010-11
$3.8 B
- Disability Tax Measures
- $285 M
- Canada Pension Plan Disabled
- $638 M
- Employment Insurance Sickness Benefits
- $165 M
- Veterans' Disability Pensions and Awards
- $407 M
- Income Assistance for the Disabled
- $777 M
- First Nations Social Assistance for the Disabled
- $57 M
- Workers' Compensation
- $693 M
- Private Disability Insurance
- $815 M
Annex 2: Provincial Data, Change in Expenditures by Program, 2005-06 to 2009-10 and 2010-11
Income Support for the Disabled by Program:
Percentage Change in Expenditures from 2005-06 to 2009-10 and 2010-11
Newfoundland and Labrador
| 2005-06 to 2009-10 | 2005-06 to 2010-11 | |
|---|---|---|
| Disability Tax Measures | 13.9% | 17.3% |
| Canada Pension Plan - Disabled | 7.4% | 10.5% |
| Employment Insurance Sickness Benefits | 45.0% | 45.0% |
| Veterans' Disability Pensions and Awards | 22.6% | 27.9% |
| Income Assistance for the Disabled | 3.7% | 6.4% |
| First Nations Social Assistance for the Disabled | 125.9% | 137.2% |
| Income Assistance and First Nations Social Assistance | 4.0% | 6.7% |
| Workers' Compensation | 19.0% | 23.4% |
| Private Disability Insurance | 5.5% | 12.7% |
Income Support for the Disabled by Program:
Percentage Change in Expenditures from 2005-06 to 2009-10 and 2010-11
Prince Edward Island
| 2005-06 to 2009-10 | 2005-06 to 2010-11 | |
|---|---|---|
| Disability Tax Measures | 21.5% | 25.2% |
| Canada Pension Plan - Disabled | 12.7% | 17.7% |
| Employment Insurance Sickness Benefits | 45.0% | 50.0% |
| Veterans' Disability Pensions and Awards | 22.6% | 27.9% |
| Income Assistance for the Disabled | 7.7% | 13.7% |
| First Nations Social Assistance for the Disabled | 9.7% | 15.2% |
| Income Assistance and First Nations Social Assistance | 7.8% | 13.7% |
| Workers' Compensation | 10.4% | 26.4% |
| Private Disability Insurance | 41.7% | 50.0% |
Income Support for the Disabled by Program:
Percentage Change in Expenditures from 2005-06 to 2009-10 and 2010-11
Nova Scotia
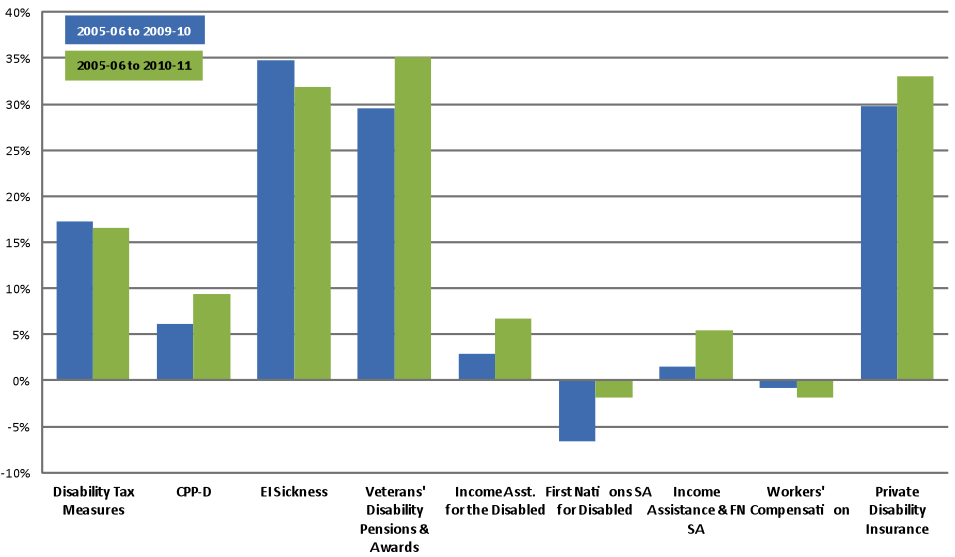
| 2005-06 to 2009-10 | 2005-06 to 2010-11 | |
|---|---|---|
| Disability Tax Measures | 17.3% | 16.5% |
| Canada Pension Plan - Disabled | 6.2% | 9.4% |
| Employment Insurance Sickness Benefits | 34.8% | 31.8% |
| Veterans' Disability Pensions and Awards | 29.5% | 35.1% |
| Income Assistance for the Disabled | 2.9% | 6.7% |
| First Nations Social Assistance for the Disabled | -6.6% | -1.9% |
| Income Assistance and First Nations Social Assistance | 1.5% | 5.5% |
| Workers' Compensation | -0.8% | -1.9% |
| Private Disability Insurance | 29.8% | 33.0% |
Income Support for the Disabled by Program:
Percentage Change in Expenditures from 2005-06 to 2009-10 and 2010-11
New Brunswick
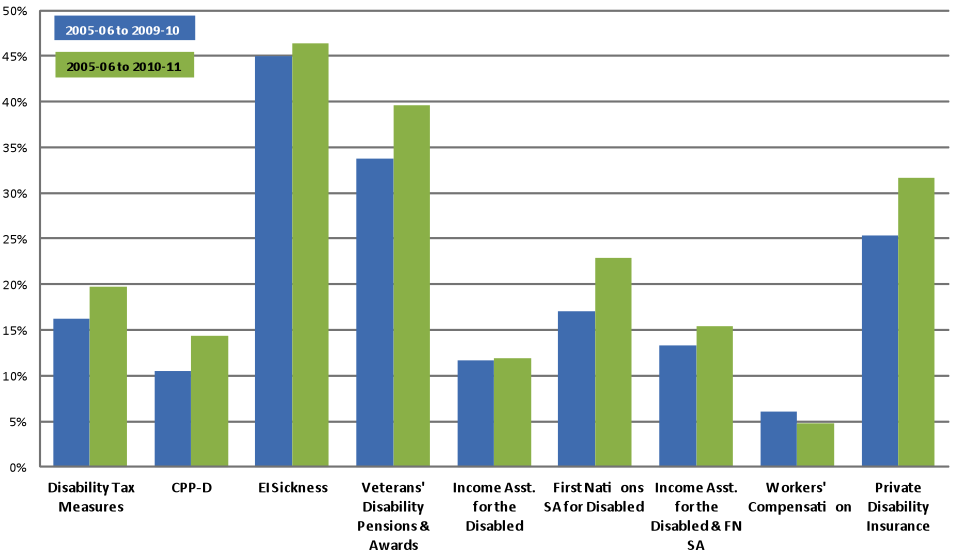
| 2005-06 to 2009-10 | 2005-06 to 2010-11 | |
|---|---|---|
| Disability Tax Measures | 16.2% | 19.7% |
| Canada Pension Plan - Disabled | 10.5% | 14.3% |
| Employment Insurance Sickness Benefits | 45.0% | 46.4% |
| Veterans' Disability Pensions and Awards | 33.7% | 39.6% |
| Income Assistance for the Disabled | 11.6% | 11.9% |
| First Nations Social Assistance for the Disabled | 17.0% | 22.9% |
| Income Assistance and First Nations Social Assistance | 113.3% | 15.4% |
| Workers' Compensation | 6.0% | 4.7% |
| Private Disability Insurance | 25.3% | 31.6% |
Income Support for the Disabled by Program:
Percentage Change in Expenditures from 2005-06 to 2009-10 and 2010-11
Quebec
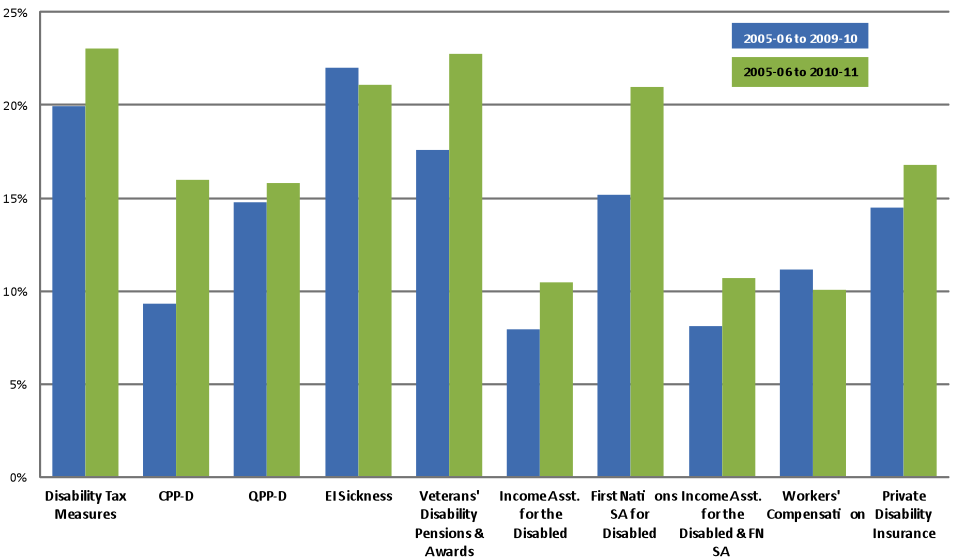
| 2005-06 to 2009-10 | 2005-06 to 2010-11 | |
|---|---|---|
| Disability Tax Measures | 19.9% | 23.0% |
| Canada Pension Plan - Disabled | 9.3% | 16.0% |
| Quebec Pension Plan Disability Benefit | 14.8% | 46.4% |
| Employment Insurance Sickness Benefits | 22.0% | 21.1% |
| Veterans' Disability Pensions and Awards | 17.6% | 22.7% |
| Income Assistance for the Disabled | 7.9% | 10.4% |
| First Nations Social Assistance for the Disabled | 15.2% | 21.0% |
| Income Assistance and First Nations Social Assistance | 8.1% | 10.7% |
| Workers' Compensation | 11.2% | 10.0% |
| Private Disability Insurance | 14.5% | 16.8% |
Income Support for the Disabled by Program:
Percentage Change in Expenditures from 2005-06 to 2009-10 and 2010-11
Ontario
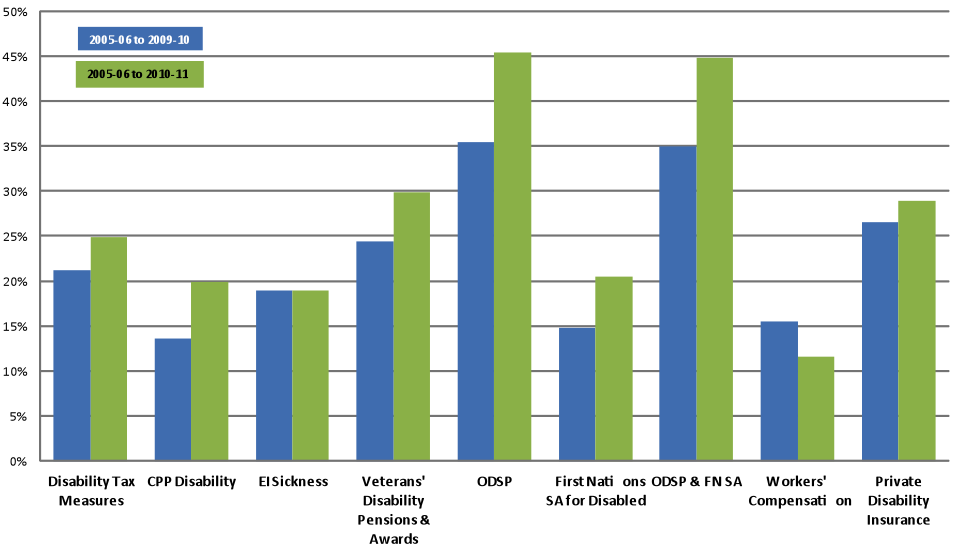
| 2005-06 to 2009-10 | 2005-06 to 2010-11 | |
|---|---|---|
| Disability Tax Measures | 21.2% | 24.8% |
| Canada Pension Plan - Disabled | 13.6% | 19.9% |
| Employment Insurance Sickness Benefits | 18.9% | 19.0% |
| Veterans' Disability Pensions and Awards | 24.4% | 29.8% |
| Ontario Disability Support Program | 35.4% | 45.4% |
| First Nations Social Assistance for the Disabled | 14.7% | 20.5% |
| Ontario Disability Support Program and First Nations Social Assistance for the Disabled | 35.0% | 44.8% |
| Workers' Compensation | 15.5% | 11.6% |
| Private Disability Insurance | 26.5% | 28.9% |
Income Support for the Disabled by Program:
Percentage Change in Expenditures from 2005-06 to 2009-10 and 2010-11
Manitoba
| 2005-06 to 2009-10 | 2005-06 to 2010-11 | |
|---|---|---|
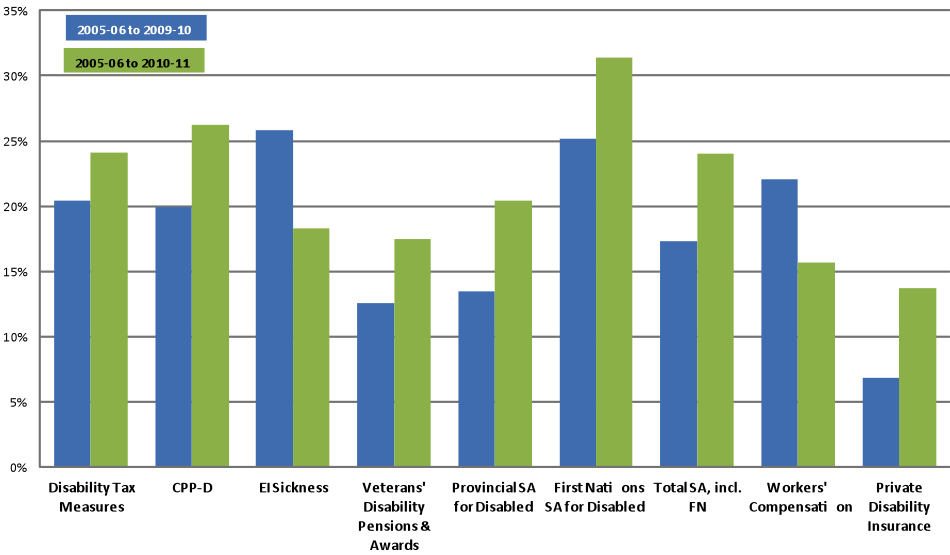
| Disability Tax Measures | 20.4% | 24.1% |
| Canada Pension Plan - Disabled | 19.9% | 26.2% |
| Employment Insurance Sickness Benefits | 25.8% | 18.5% |
| Veterans' Disability Pensions and Awards | 12.6% | 17.5% |
| Provincial Social Assistance for the Disabled | 13.5% | 20.5% |
| First Nations Social Assistance for the Disabled | 25.1% | 31.4% |
| Total Social Assistance, Including First Nations Social Assistance for the Disabled | 17.3% | 24.0% |
| Workers' Compensation | 22.1% | 15.7% |
| Private Disability Insurance | 6.8% | 13.7% |
Income Support for the Disabled by Program:
Percentage Change in Expenditures from 2005-06 to 2009-10 and 2010-11
Saskatchewan
| 2005-06 to 2009-10 | 2005-06 to 2010-11 | |
|---|---|---|
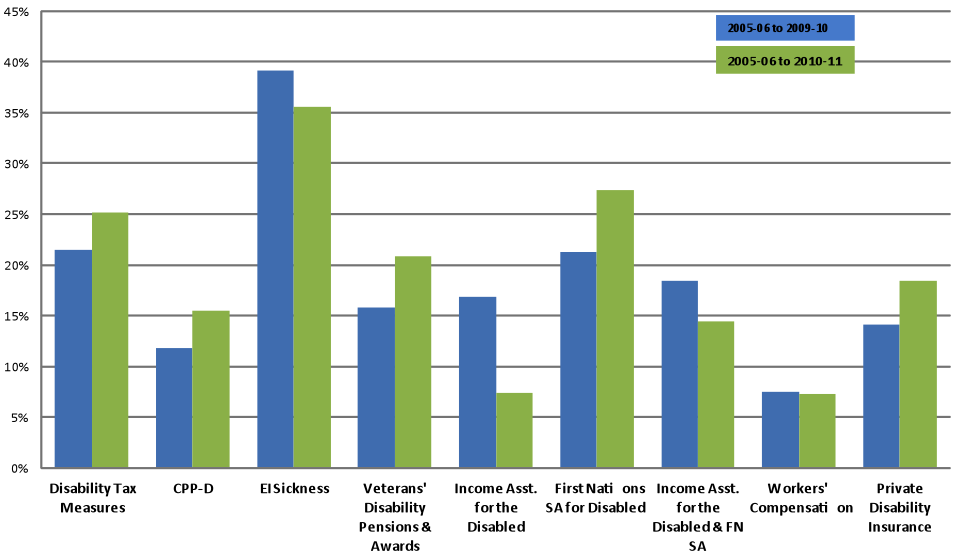
| Disability Tax Measures | 21.5% | 25.2% |
| Canada Pension Plan - Disabled | 11.8% | 15.5% |
| Employment Insurance Sickness Benefits | 39.2% | 35.5% |
| Income Assistance for the Disabled | 15.8% | 20.8% |
| Veterans' Disability Pensions and Awards | 16.9% | 7.4% |
| First Nations Social Assistance for the Disabled | 21.3% | 27.3% |
| Income Assistance for the Disabled and First Nations Social Assistance for the Disabled | 18.4% | 14.5% |
| Workers' Compensation | 7.5% | 7.3% |
| Private Disability Insurance | 14.1% | 18.5% |
Income Support for the Disabled by Program:
Percentage Change in Expenditures from 2005-06 to 2009-10 and 2010-11
Alberta
| 2005-06 to 2009-10 | 2005-06 to 2010-11 | |
|---|---|---|
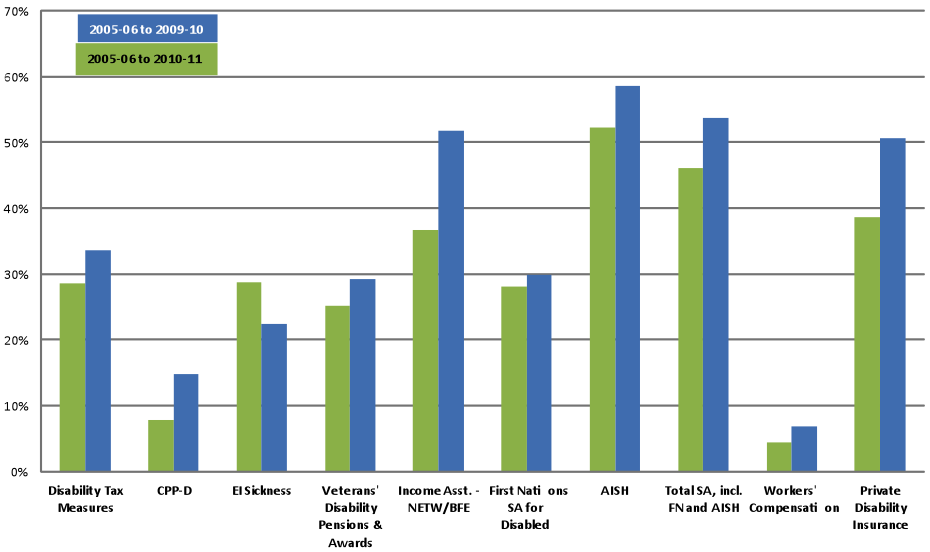
| Disability Tax Measures | 28.6% | 33.7% |
| Canada Pension Plan - Disabled | 7.9% | 14.8% |
| Employment Insurance Sickness Benefits | 28.8% | 22.3% |
| Income Assistance for the Disabled | 25.1% | 29.3% |
| Veterans' Disability Pensions and Awards | 36.7% | 51.8% |
| Income Assistance - NETW/BFE | 28.1% | 29.8% |
| First Nations Social Assistance for the Disabled | 52.2% | 58.5% |
| Assured Income for the Severely Handicapped | 46.0% | 53.7% |
| Total Social Assistance, Including First Nations Social Assistance for the Disabled and Assured Income for the Severely Handicapped | 4.5% | 6.9% |
| Workers' Compensation | 38.7% | 50.6% |
| Private Disability Insurance | 14.1% | 18.5% |
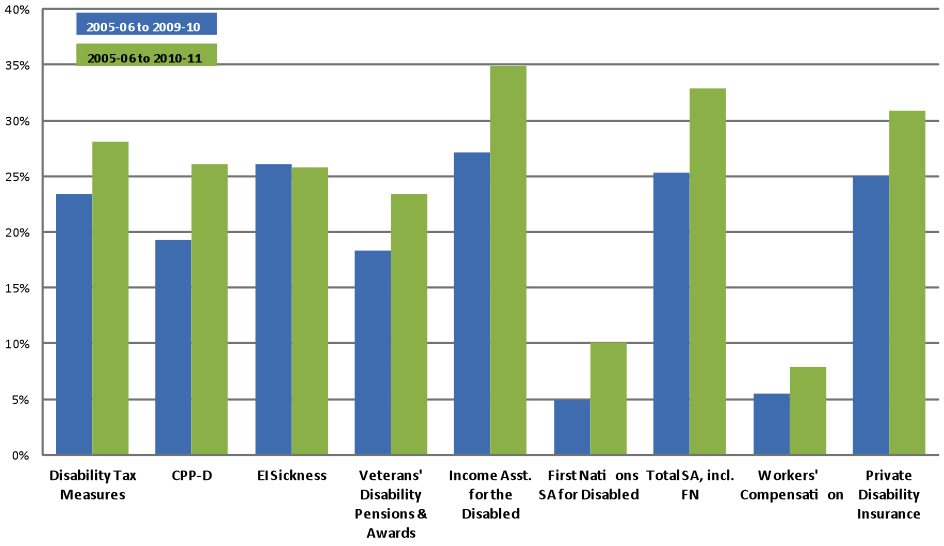
Income Support for the Disabled by Program:
Percentage Change in Expenditures from 2005-06 to 2009-10 and 2010-11
British Columbia
| 2005-06 to 2009-10 | 2005-06 to 2010-11 | |
|---|---|---|
| Disability Tax Measures | 23.4% | 28.1% |
| Canada Pension Plan - Disabled | 19.3% | 26.1% |
| Employment Insurance Sickness Benefits | 26.1% | 25.8% |
| Veterans' Disability Pensions and Awards | 18.3% | 23.4% |
| Income Assistance for the Disabled | 27.1% | 34.9% |
| First Nations Social Assistance for the Disabled | 4.9% | 10.1% |
| Total Social Assistance, Including First Nations Social Assistance for the Disabled | 25.3% | 32.8% |
| Workers' Compensation | 5.5% | 7.9% |
| Private Disability Insurance | 25.0% | 30.8% |
Annex 3: Sources and Methodology
| Income Support Category | Data Source(s) | Methodology |
|---|---|---|
| Disability Tax Measures | Dept. of Finance Tax Expenditure Report for all measures except the Child Disability Benefit.< br/>http://www.fin.gc.ca/taxexp-depfisc/2011/taxexp1101-eng.asp#toc6 < br/>< br/> Office on Disability Issues annual report, appendices for Child Disability Benefit. < br/>< br/>http://www.hrsdc.gc.ca/eng/disability_issues/reports/fdr/2010/fdr_2010.pdf | Provincial data not available. Data have been estimated using the federal amounts multiplied by each province's estimated percentage of the total population. |
| CPP Disability |
HRSDC — OAS and CPP Statistics book for national data br /> HRSDC—ISP monthly statistical bulletin for provincial data (Reports available by request from HRSDC) |
Net benefits paid by fiscal year. |
| QPP Disability |
HRSDC—OAS and CPP Statistics book (Report available by request from HRSDC) |
Net benefits paid by fiscal year. |
| EI Sickness |
EI Monitoring and Assessment Report, Annex 2 http://www.hrsdc.gc.ca/eng/employment/ei/reports/eimar_2010/annex/annex2_11.shtml |
Amount paid by fiscal year. |
| Veterans' Disability Pension & Awards |
Office on Disability Issues annual report, appendices for national data http://www.hrsdc.gc.ca/eng/disability_issues/reports/fdr/2010/fdr_2010.pdf HRSDC's Social Security Statistics report, Table 154 for provincial estimates (available by request from HRSDC) |
Provincial data estimated based on provincial distribution of Disability Pensions reported in unpublished Social Security Statistics report. |
| P/T Social Assistance Programs |
Provincial and territorial public accounts, main estimates and annual report. See TABLE 3B for details. |
Only 5 provinces—New Brunswick, Ontario, Manitoba, Alberta and BC—report disability fiscal year expenditures for Social Assistance. A national figure of 55% of total SA expenditures is used to estimate SA expenditures on the disabled based on these data. |
| First Nations Social Assistance | HRSDC's Social Security Statistics report, Table 141 (available by request from HRSDC) | First Nations spending on the disabled has been estimated based on the national estimate of 55% of total spending. |
| Workers' Compensation—provincial/territorial |
Association of Workers Compensation Boards of Canada—Key Statistical Indicators—Basic Accounting Measures, line 51 minus line 5.11 https://aoc.awcbc.org/KsmReporting/ReportDataConfig |
Amounts represent net benefits paid less benefits for health and rehabilitation services. |
| Workers' Compensation—federal |
Office on Disability Issues annual report appendices. http://www.hrsdc.gc.ca/eng/disability_issues/reports/fdr/2010/fdr_2010.pdf |
|
| Private Disability Insurance—STD and LTD | Canadian Life and Health Insurance Association (available by request) | Based on Direct Claims paid, which represent the actual amounts paid to insured individuals. |
| Province | Source | Methodology | |
|---|---|---|---|
| NF |
Report on Program Expenditures & Revenue of CRF, 2010-11 - see page 141438, category Income Assistance—allowances and assistance. http://www.fin.gov.nl.ca/fin/publications/CRFreport_march2011.pdf |
Estimated at 25% of total spending based on caseload distribution by reason for assistance in Annual Reports. | |
| PEI |
PEI Public Accounts 09-10, see Dept. of Community Services and Seniors, Social Programs page 152, See "cash and material benefits" and "special needs" |
Used national estimate of 55% of total SA expenditures | |
| NS |
NS Estimates, Supplementary Detail, 2010-11 See page 4.10 Income Assistance payments, forecast amount http://www.gov.ns.ca/finance/site-finance/media/finance/budget2010/estimatesandsupdetail2010-11.pdf |
Used national estimate of 55% of total SA expenditures | |
| NB |
Public Accounts year ended March 2010, Vol. II. See page 179 http://www.gnb.ca/0087/pubacct/PA11v2.pdf |
Extended Benefits Program expenditures | |
| QUE |
2010-11 Public Accounts, Vol. II, page 2-108 Assistance to Individuals and Families- transfers. http://www.finances.gouv.qc.ca/documents/Comptespublics/en/CPTEN_vol2-2010-2011.pdf |
Estimated at 44% of total Social Assistance expenditures based on March expenditure distribution by program See Tableau 1 http://www.mess.gouv.qc.ca/statistiques/prestataires-assistance-emploi/index_en.asp |
|
| ONT |
2010-11 Public Accounts, Vol. I See page 2-93, financial assistance amounts only. OW amounts have been increased to reflect the municipal contribution. http://www.fin.gov.on.ca/en/budget/paccts/2011/11vol1eng.pdf |
ODSP financial assistance expenditures | |
| MAN |
Manitoba Family Services and Housing Annual Report 2010-11. See pages 76 and 77 https://www.gov.mb.ca/fs/about/annual_reports/fsca_ar_2011_12.pdf |
SA for the disabled plus IAPD | |
| SASK |
Public Accounts, 2009-10 Volume II, page 199—'SAP" and "TEA" transfers http://www.finance.gov.sk.ca/paccts/paccts11/201011Volume2.pdf |
Used national estimate of 55% of total SA expenditures | |
| ALTA |
Main Estimates 2012-13, Employment & Immigration section. See page 156 Income support Main Estimates 2011-12, Seniors and Community Supports section. See page 227, AISH, financial assistance only, 10-11 actual http://www.finance.alberta.ca/publications/budget/budget2012/index.html#estimates |
Income Support—"Barriers to Full Employment" component | |
| BC |
Public Accounts 2010-11—Consolidated Revenue Fund Supplementary Schedules. See Ministry of Housing and Social Development section, Temporary Assistance and Disability Assistance—"transfer payments" page 93 http://www.fin.gov.bc.ca/OCG/pa/09_10/CRF_Supplementary_Sched.pdf |
Disability Assistance transfer payments |
Annex 4: Data sources relating to demographics and labour market participation of people with disabilities
The Longitudinal Administrative Databank (LAD) comprises a 20% sample of the annual T1 Family File provided to the Canada Revenue Agency. It contains demographic information and income information about labour market participants, including amount of labour market earnings and income from other sources.
The Survey of Labour and Income Dynamics (SLID) provides longitudinal data on more than 30,000 Canadian households. Two panels of households are surveyed for six consecutive years, answering the same questions. One limitation of this source is that it provides data on disability, but not workplace disability specifically.
The Participation and Activity Limitation Survey (PALS) contains useful data on people living with activity limitations. However, the last survey was conducted in 2006, which may make the data not useable.
Data sources relating to disability expenditures
Statistics Canada provides data on disability expenditures in a variety of sources. No single source can provide all the data needed, but information from several sources can help confirm the trends we have identified.
The LAD provides data on disability tax credits, CPP Disability, workers' compensation, and social assistance from 1992 to 2009. It can also follow people with disabilities over time, enabling an analysis of, for example, the duration of individuals' use of disability deductions/credits. However, the LAD does not distinguish between regular Employment Insurance benefits and EI Sickness benefits. A significant limitation is that it cannot identify people with disabilities unless they are receiving disability tax credits, CPP Disability, workers' compensation, and/or social assistance.
As for veterans' pensions, no information can be found in tax data or on SLID.
- [1]http://www.iwh.on.ca/briefings/a-patchwork-quilt
- [2]http://openpolicyontario.com/wordpress/wp-content/uploads/2012/02/NavigatingtheMazeFinal.pdf p.13
- [3]Angelica and Bob are both Ontario composites
- [4]In 2005-06, detailed expenditure data on income support programs for persons with a disability were first collected for inclusion in the report Navigating the Maze.
- [5]All amounts are in current dollars.
- [6]Statistics Canada, CANSIM Table 051-0001, Estimates of population, by age group and sex for July 1, Canada, provinces and territories. http://www5.statcan.gc.ca/cansim/a26?lang=eng&retrLang=eng&id=0510001&paSer=&pattern=&stByVal=1&p1=1&p2=37&tabMode=dataTable&csid=
- [7]Statistics Canada, Participation and Activity Limitation Survey 2006: Labour Force Experience of People with Disabilities in Canada.
- [8]http://www.mowateitaskforce.ca/sites/default/files/Stapleton.pdf, p.12
- [9]For example, Ontario Disability Support Plan (ODSP) growth in persons with neuroses and psychoses in 2011 was double the growth in the program overall.
- [10]In Ontario, Alberta and British Columbia, disability caseloads increased between 35% and 39% between March 2005 and 2011.
- [11]CPP-D benefits are taken into account when calculating a claimant's entitlement to benefits under other disability programs.
- [12]Again, these are Employment Insurance sickness benefits (EI Sickness), Canada Pension Plan/Quebec Pension Plan disability benefits (CPP-D and QPP-D), Veterans’ disability pensions and awards, private disability insurance, workers’ compensation.
- [13]See Annex 2 for an overview of our research sources and methodology. The expenditures have been estimated using the methodology outlined.
- [14]Expenditures exclude RDSPs.
- [15]See Annex 2 and Annex 3 for program details for each province.
- [16]Saskatchewan Assured Income for Disability (SAID) is not included.
- [17]AISH benefits were increased several times between 2005-06 and 2010-11.
- [18]http://www.mowateitaskforce.ca/sites/default/files/Stapleton.pdf
- [19]Human Resources and Skills Development Canada – see http://www4.hrsdc.gc.ca/.3ndic.1t.4r@-eng.jsp?iid=36
- [20]The legislation may provide for distinct program streams for different types of clients(e.g. in Saskatchewan the creation of SAID).
- [21]The Centre for Addiction and Mental Health, The Aspiring Workforce: Employment and Income for People with Serious Mental Illness, pg. 87.
- [22]Angelica and Bob are Ontario examples.
End Exclusion supporters rally in support of an accessible and inclusive Canada.