Act Now

Empower U: Learn to Access Your Disability Rights Training on Canadian Human Rights, the Convention on the Rights of Persons with Disabilities (CRPD) and its Optional Protocol (OP) training aims to increase awareness of how to address discrimination using more familiar Canadian human rights laws such as Human Rights Codes and the newer international Convention on the Rights of Persons with Disabilities (CRPD). This is training for persons with disabilities by persons with disabilities. The training is part of a project funded by Employment and Social Development Canada and implemented by the Council of Canadians with Disabilities (CCD) in collaboration with Canadian Multicultural Disability Centre Inc. (CMDCI), Citizens With Disabilities – Ontario (CWDO), Manitoba League of Persons with Disabilities (MLPD) and National Educational Association of Disabled Students (NEADS). Read more.
Sign Up for our monthly digest
A monthly newsletter from CCD about what is happening in the community
Disabling Poverty and Enabling Citizenship: Understanding the Poverty and Exclusion of Canadians with Disabilities
Related Documents
December 10, 2014
Understanding the Poverty and Exclusion of Canadians with Disabilities
November 30, 2013
Looking Into Poverty: Income Sources of Poor People with Disabilities in Canada
November 1, 2011
Gender, Disability and Low Income
Researched and written by Cameron Crawford for the Community–University Research Alliance between the Council of Canadians with Disabilities and University of Victoria
Contents
I. Overview
II. Primary Data Source: Participation and Activity Limitation Survey (PALS)
III. Defining Key Terms
IV. Findings
A. General Socio-demographic Characteristics
- Geographic Location
- Gender
- Age
- Visible Minority and Aboriginal Person Status
- Living Arrangements and Housing
- Education and Work-related Training
- Labour Force Status and Work Arrangements
- Employment Discrimination
B. Disability and Health-Related Characteristics
- Type of Disability
- Age at Disability Onset
- Severity of Disability
- Help with Everyday Activities
- Self-reported General Health
- Self-reported Stress
V. Summary of Findings, Conclusion and Next Steps
VI. References
I. Overview
The low income and income insecurity of a great many people with disabilities has been a longstanding issue in Canada. It has been flagged by the Government of Canada and by various committees of Parliament (Parliamentary Special Committee on the Disabled and the Handicapped, 1981; Federal Task Force on Disability Issues, 1996; Sub-Committee on The Status of Persons with Disabilities of the Standing Committee on Human Resources Development and the Status of Persons with Disabilities, 2001; Canada, 2003), by Statistics Canada (Galarneau & Radulescu, 2009) and other researchers (Kapsalis & Tourigny, 2007) and has been an ongoing focus of policy attention by major disability organizations (e.g., Council of Canadians with Disabilities [CCD], 2003, 2004, 2005, 2006, 2007, 2008, 2009; Canadian Association for Community Living [CACL], 2006; 2009).
In terms of financial and human costs, Health Canada (2002) has estimated that the annual indirect financial cost to the Canadian economy in terms of lost productivity stemming from the non-employment of people with long-term disabilities was $32.2 billion in 1998, which translates to $40.2 in 2008 dollars (Statistics Canada, 2009b). As noted by Kapsalis and Tourigny (2007), lack of labour force participation has a major effect on the likelihood of low income and people with disabilities are at significant risk of low income due to their lesser likelihood of employment. Financially less tangible human costs of non-employment can include poorer health, premature mortality, psychological distress and suicide, criminal behaviour, loss of human capital and family breakdown (Eardley, 2002).
The UN High Commissioner for Human Rights (UNHCHR) and the UN Committee on Economic, Social and Cultural Rights (CESCR) have detailed positive duties under the International Covenant on Economic, Social and Cultural Rights (ICESCR) with respect to persons with disabilities' right to work. The Covenant also obliges States Parties' duty to uphold everyone's right to an adequate standard of living. Canada has ratified this Covenant and has obligations under it. These include fostering the integration of people with disabilities within the regular labour force rather than in segregated employment (UNHCHR, 1994) and a range of other duties to respect, protect and help fulfil the right to work (CESCR, 2006). On March 11, 2010, Canada ratified the Convention on the Rights of Persons with Disabilities (United Nations [UN], 2006; UN, 2010), which again articulates the right to work and to an adequate standard of living for persons with disabilities as a specific group.
Despite Canada's obligations under international agreements and the major costs associated with the non-employment of people with disabilities, relatively little has been written about people with disabilities who are living on low incomes. The present report aims to help close that knowledge gap. The research draws primarily from Statistics Canada's Participation and Activity Limitation Survey (PALS) of 2006 and provides a profile of people with disabilities in terms of their general socio-demographic characteristics such age, gender, visible minority and Aboriginal person status, education level and labour force status and in terms of selected disability-specific characteristics that are discussed in the body of the report.
II. Primary Data Source: Participation and Activity Limitation Survey (PALS)
PALS has been Statistics Canada's 'flagship' survey on disability. Conducted in the fall and winter of 2001-2002 and 2006-2007 it gathered a wealth of data about the nature and degree of disability, as well as on a range of disability-specific issues, such as the kinds of human and technological support required at home, school, work and in the community and the kinds of barriers to full citizenship and participation that people with disabilities encounter. PALS built upon its predecessor survey, the Health and Activity Limitation Survey of 1986 and 1991, which was similar in many respects. PALS has a children component that focuses on young people birth to 14 years and an adult component that focuses on people fifteen years and older. The present report draws from published reports based on PALS by Statistics Canada and from the public use microdata file (PUMF) for the adult component. Where data needed for this research were suppressed by Statistics Canada on the PUMF, the research drew from the more detailed PALS Master (microdata) File.
The Public Use and Master microdata files both provide 'raw' data that facilitate complex research explorations and hypothesis tests.
III. Defining Key Terms
Disability
As operationalized in PALS, a 'disability' is any ongoing or recurring difficulty hearing, seeing, communicating, walking, climbing stairs, bending, learning or doing any similar activities or, because of a physical condition or mental condition or health problem, a reduction in the amount or kind of activity that a person can do at home, work or school or in other activities such as transportation or leisure. In order to be selected into PALS as having a disability, a respondent had to indicate any such limitations on the Census Long Form, which was administered to 20% of Canadian households on May 16, 2006 and again at the beginning of the PALS interview. PALS was conducted in the autumn and winter of 2006-2007 (Statistics Canada, 2009c). Once 'in' PALS, respondents were then asked a large number of questions about the specific kinds of functional limitations they experience, the supports (e.g., human, technological, pharmacological, built environmental, transportation) that are needed at home, school, work, for recreation and in the community more generally, as well as context-specific barriers and other difficulties that may be encountered in those settings.
As the PALS interview data are linked to the Census, selected general information (e.g., age, gender, income level, labour force status, type of dwelling) is available for people with and without disabilities. The present report provides some limited comparative analysis of the income situation of people with and without disabilities.
Low Income
Statistics Canada (2009a) has developed several measures of low income. The only measure that is available on the 2006 PALS data file, however, is the Low Income Cut-Off (LICO). The LICO is defined as the household income level where a household spends 20% or more than the average on food, shelter and clothing. When calculating LICOs, Statistics Canada takes into account the number of people in the household and the population size of the community in which the household is situated (Statistics Canada, 2008c). Statistics Canada calculates both before tax and after tax LICOs. The present report uses the after tax LICO, which reflects disposable income after taxes are paid and tax credits are taken into account, such as the Disability Tax Credit and the Medical Expenses Tax Credit. It is important for the reader to bear in mind that the LICO does not take into account the out-of-pocket cash value of non-insured disability-specific expenses such as the cost of aids and devices for mobility (e.g., wheelchairs), communication (voice amplifiers, keyboard devices), learning (e.g., Braille output or speech access devices for computers, talking books), medications (e.g., for psychological well-being or pain management) or services (e.g., attendants, tutors, note takers, sign language interpreters). That is, the LICO likely underestimates 'poverty' by some unknown measure for people with disabilities who face such costs.
As stated by Statistics Canada, "Since their initial publication, Statistics Canada has clearly and consistently emphasized that the LICOs are not measures of poverty. Rather, LICOs reflect a consistent and well-defined methodology that identifies those who are substantially worse off than average" (Statistics Canada, 2010). That said, the LICO has long been used as a measure of poverty and is sometimes referred to as the 'poverty line' (National Council of Welfare, 2008). The present report uses the terms 'low incomes', 'low household incomes' and 'below the poverty line' interchangeably.
Based on this approach, nearly half a million working-age people with disabilities (499,960) or 20.5% live on low household incomes.
Working-age Population
The present research focuses on the working-age population, defined for the purposes of this report as people 15 to 64 years, which includes 2.4 million Canadians with and 18.7 million without disabilities.
A focus on working-age people has been adopted because, as Chart 1 shows, low income is a significant problem for large numbers of people with disabilities from age 15 up to 64 years, after which the poverty rate drops significantly and falls closely into line with the rate for people without disabilities.
| Age group | Without disability | With disability |
|---|---|---|
| 15-19 | 11.3% | 17.0% |
| 20-24 | 16.3% | 23.2% |
| 25-29 | 12.5% | 22.9% |
| 30-34 | 10.3% | 17.4% |
| 35-39 | 11.4% | 18.3% |
| 40-44 | 8.7% | 22.7% |
| 45-49 | 7.9% | 23.0% |
| 50-54 | 6.6% | 18.8% |
| 55-59 | 8.5% | 22.1% |
| 60-64 | 8.8% | 18.3% |
| 65-69 | 6.0% | 7.3% |
| 70-74 | 4.0% | 5.4% |
| 75-79 | 5.9% | 4.9% |
| 80-84 | 6.0% | 7.0% |
| 85+ | 11.8% | 3.9% |
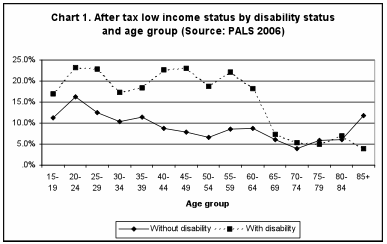
The spike in low income among people without disabilities in the 85 and older group may be an effect of low population counts (sampling error); that piece of data should be used with caution.
IV. Findings
A. General Socio-demographic Characteristics
This section of the report provides findings in relation to the general socio-demographic characteristics of survey respondents. The section covers their geographic location, gender, age, visible minority and Aboriginal person status, living arrangements and housing, education and work-related training, labour force status and work arrangements.
Geographic Location
Research has shown how the rates of employment for people with disabilities vary significantly depending on province/territory of residence, with lower levels of employment found from Quebec eastwards (Roeher Institute, 1993; 2004; Statistics Canada, 2008a).
Statistics Canada has not created a LICO for people living in the northern territories (Yukon, Northwest Territory, Nunavut). Accordingly, the northern territories have been excluded from the present research. Chart 1 shows the rates of low income among people with and without disabilities by province. Overall, people with disabilities are nearly twice as likely (1.9 times more) to be living in poverty than people without disabilities (22.9% vs. 9.1%). The ratio is lowest in British Columbia, where people with disabilities are 1.5 times more likely to live in poverty (19.6% vs. 13.2%), and highest in Quebec, where they are 2.7 times more likely (32% vs. 12%). The relative likelihood of people with disabilities living in poverty is also high in Newfoundland and Labrador (2.5 times more likely) and New Brunswick and Prince Edward Island (2.3 times).[1]
| Province | Without disability | With disability |
|---|---|---|
| Newfoundland and Labrador | 9.1% | 22.9% |
| Nova Scotia | 8.9% | 16.8% |
| New Brunswick & Prince Edward Island | 7.7% | 17.3% |
| Quebec | 12.0% | 32.0% |
| Ontario | 10.3% | 18.3% |
| Manitoba | 9.7% | 20.1% |
| Saskatchewan | 9.5% | 17.4% |
| Alberta | 8.5% | 13.7% |
| British Columbia | 13.2% | 19.6% |
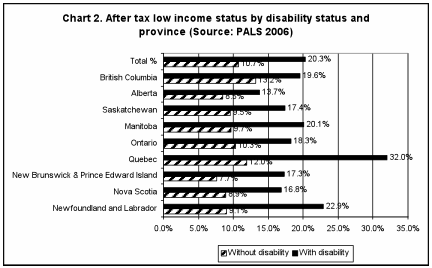
Type and size of community also make a difference, with people who live in rural communities about half as likely as urban dwellers to be living on low incomes. For instance, among people with disabilities who live in rural communities, 11.3% live on low incomes compared with 22.9% of their urban counterparts. For people without disabilities the rates are 5.6% and 11.4%, respectively.
Gender
Women are slightly more likely than men to report disability (53.2% vs. 46.8%) and are generally less likely to be employed than men (Brooks, 2005; Statistics Canada, 2008b), which can be explained in part by childrearing and elder care responsibilities which fall disproportionately to women (Timpson, 2001; Johnson & Sasso, 2006). There are issues that women with disabilities face in particular, however (Fawcett, 2000), which include their greater tendency to live as a lone parent, their more limited opportunities for stable and high-paying jobs and limited opportunities for assistance with household tasks. Gender also has a part to play in educational and occupational choices, e.g., women are less likely than men to have post-secondary education in business and the sciences and are more likely to have jobs in nursing and education (International Labour Office, 2004).
It seemed reasonable to infer that women with disabilities would be more likely than men to be living in low-income households. The inference turned out to be correct, although there is not a major overall difference: among women with disabilities, 21.3% are in households with incomes below the LICO and among their male counterparts, 19.6%.
Age
Implications of the aging process need to be included among the factors that have a bearing on employment (Kuhn, 2003) and income, with attention to issues that may be of particular importance concerning people with disabilities (Warwick Institute for Employment Research & Economix Research & Consulting, 2006). Statistics Canada has pointed to the significantly different and consistently low rates of employment of people with and without disabilities over the working years, which have implications for incomes (Statistics Canada, 2003b, 2008b). As Chart 3 shows, irrespective of age up to 64 years, working-age people with a disability are about twice as likely as those without to be living on a low income.
Indeed, while people with disabilities made up only 11.5% of the working-age population in 2006, depending on the jurisdiction, between 14.8% and 67.4% of social assistance recipients are persons with long-term disabilities (Federal-Provincial-Territorial Directors of Income Support, 2005). That is, depending on the jurisdiction, working-age people with disabilities are from about 1.3 to 6 times more likely to be in the social assistance 'system' than people without disabilities and overall are more than three times more likely. Regardless of jurisdiction, social assistance incomes amount to about half the value of LICO incomes and LICO incomes are generally quite low to begin with (National Council of Welfare, 2008).
| Age group | Without disability | With disability |
|---|---|---|
| 15-19 | 11.3% | 17.0% |
| 20-24 | 16.3% | 23.2% |
| 25-29 | 12.5% | 22.9% |
| 30-34 | 10.3% | 17.4% |
| 35-39 | 11.4% | 18.3% |
| 40-44 | 8.7% | 22.7% |
| 45-49 | 7.9% | 23.0% |
| 50-54 | 6.6% | 18.8% |
| 55-59 | 8.5% | 22.1% |
| 60-64 | 8.8% | 18.3% |
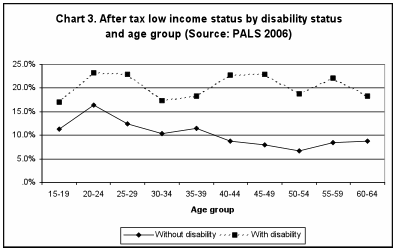
In contrast, the rate of low income among people with disabilities drops significantly after age 64 and remains quite low throughout the retirement years (Chart 1), which suggests that the income security system for seniors, as well as tax measures and drug and benefit plans, comes into play to ease the burden of poverty for seniors with disabilities.
Further scrutiny of PALS confirms that impression. From 15 to 64 years, people with disabilities and living below the after tax LICO received, on average, $5,825 per person from all government transfers combined. This works out to 37.5% of their total household income. People without disabilities and living below the LICO received on average $3,084, or 14.4% of total household income. Those with disabilities aged 65 and older, however, received $12,252 per person in government transfers if living below the LICO (comprising 66% of household income) and $12,976 if living above the LICO (21.7% of household income). The average amounts for their non-disabled counterparts were $11,999 (68.5% of household income) if living below the LICO and $11,369 if living above it (17.9% of household income). For people with and without disabilities, then, the average amount received in government transfers roughly doubled after age 65. Most of this money flowed from the Old Age Security program, the Guaranteed Income Supplement and the Canada/Quebec Pension Plan retirement benefits, all of which target seniors and whose effects help lift people out of the poverty much more pervasively experienced in the working years.
Also, among PALS respondents who answered the questions about use of medications, a slightly higher proportion of seniors 65 years and older with disabilities than their working-age counterparts had direct expenses for drugs that were not covered by any private or public plan in the 12 months leading up to PALS (71.2% vs. 66.8%, respectively). Seniors with disabilities were much more likely to be taking four or more prescription drugs daily (53.1% vs. 34.6%). Yet seniors with disabilities were much less likely than their working-age counterparts to indicate that they were unable to get needed drugs because of cost (4.1% vs. 13.7%) or that they took less of the medications they needed due to cost (4% vs. 14%).
Visible Minority and Aboriginal Person Status
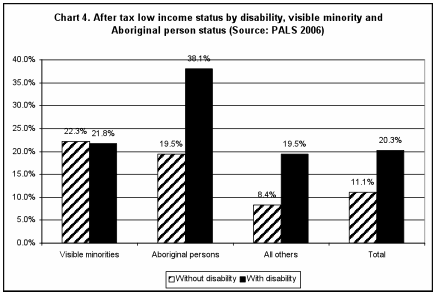
Visible minority, immigrant and Aboriginal person status have a bearing on educational choices and occupational trajectories (e.g., Brown, 2002). Such demographic characteristics and attendant value systems can have specific implications for people with disabilities (e.g., Hogansen, Powers, Geenen, Gill-Kashiwabara & Powers, 2008; Campbell, 2008). Chart 4 shows that about 22% of visible minorities have low incomes, irrespective of disability. Those rates are slightly higher than they are for people with disabilities who do not self-report being a member of a visible minority or an Aboriginal person (19.5%). The rates for visible minorities, however, are much higher than for working-age people without disabilities (8.4%).
The rate of low income among Aboriginal persons with disabilities is nearly twice that for persons with disabilities who do not self-report being a member of a visible minority or an Aboriginal person (38.1% vs. 19.5%).
| Status | Without disability | With disability |
|---|---|---|
| Visible minorities | 22.3% | 21.8% |
| Aboriginal persons | 19.5% | 38.1% |
| All others | 8.4% | 19.5% |
| Total | 11.1% | 20.3% |
Living Arrangements and Housing
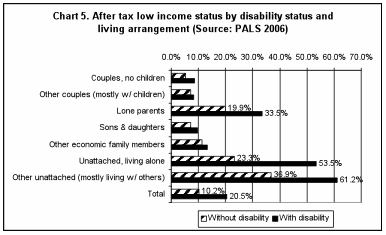
Fawcett (1996) has observed that a person's marital status and living arrangements (e.g., living with family, alone, with non-family others) has a bearing on employment and therefore income. The present research found significant differences in the proportions of people living below the poverty line that are related to living arrangements. First of all, people with disabilities are somewhat more likely than people without to be lone parents (7.3% vs. 5%) and are nearly twice as likely to be living alone (17.3% vs. 9.4%). They are as likely as people without disabilities to be living with unrelated others, with both at 4.1%.
Chart 5 shows that lone parents are more likely to have low incomes than couples with children. However, lone parents with disabilities are much more likely to be living on low incomes (33.5%) than their counterparts without disabilities (19.9%).
As well, more than half of working-age people with disabilities who live alone live on low incomes (53.5%) as do almost two-thirds (61.2%) who live with unrelated others. For people without disabilities, the respective low-income rates are 23.3% and 36.9%.
| Living arrangement | Without disability | With disability |
|---|---|---|
| Couples, no children | 5.2% | 8.7% |
| Other couples (mostly w/ children) |
7.2% | 8.2% |
| Lone parents | 19.9% | 33.5% |
| Sons & daughters | 7.1% | 9.6% |
| Other economic family members | 11.3% | 13.2% |
| Unattached, living alone | 23.3% | 53.5% |
| Other unattached (mostly living w/ others) |
36.9% | 61.2% |
People with disabilities are about a quarter more likely than people without disabilities to live in rental housing instead of housing owned by someone who lives in the same dwelling (30.8% vs. 24.4%). However, among people with disabilities who live in rental housing, nearly half (44%) are in low-income households compared with about a quarter (24.7%) of their counterparts without disabilities.
Given that people with disabilities are twice as likely as people without to be in low-income households, it is perhaps not too surprising to find that they are also about twice as likely to live in housing that stands in greater need of major repairs, such as for defective plumbing, electrical wiring, structural repairs to walls, floors or ceilings, etc. (12.1% vs. 6.6%). Among people with disabilities in low-income situations, 15.5% are in places that are in need of major repairs, compared with 9.8% of their counterparts without disabilities.
Thinking about this another way, among people with disabilities who live in places that require major repairs, more than a quarter (26.5%) have incomes below the poverty line compared with 15.3% of their counterparts without disabilities.
Education and Work-related Training
Education also has a positive bearing on employment and income (Comfort, Johnson, & Wallace. (2003). To begin with, working-age people with disabilities have lower levels of education in that they are more likely not to have received a high school graduation certificate (27.4% compared with 18.3% of people without disabilities) and are less likely to have a degree or other certificate from a university (13.2% vs. 20.7%).
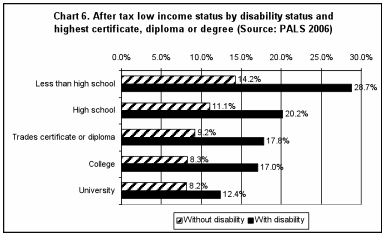
Even with higher levels of education, however, the poverty rate is still high among people with disabilities. For instance, as Chart 6 shows, people with disabilities generally remain about twice as likely as people without to have low incomes irrespective of highest educational certificate, diploma or degree. The exception is where people with disabilities have a degree, diploma or other certificate from a university; they are 1.5 times more likely instead of twice as likely to have low incomes. That said, the prevalence of poverty among people with disabilities does decrease with increases in formal educational attainment.
Lack of access to work-related training is also associated with people with disabilities having low incomes. Among those who were active in the labour force at some point from 2001 through 2006, 10% who took classroom-based or on-the-job training at some point during those years have low incomes, compared with 19.6% of people with disabilities who received no such training. Among those who were not asked about training,[2] 27.6% have low incomes. Historically, the participation rates of people with disabilities have been quite low within the generic labour market development system under Part II of the Employment Insurance Act (e.g., Annexes, Canada Employment Insurance Commission, 1999 and 2007).
| Education/training | Without disability | With disability |
|---|---|---|
| Less than high school | 14.2% | 28.7% |
| High school | 11.1% | 20.2% |
| Trades certificate or diploma | 9.2% | 17.8% |
| College | 8.3% | 17.0% |
| University | 8.2% | 12.4% |
Labour Force Status and Work Arrangements
Despite the fact that Canada led the G8 countries in employment growth from 2001 to 2006 and the employment situation of people with disabilities improved slightly over those years, Canadians with disabilities have persistently remained much less likely to be employed than people without disabilities. According to Statistics Canada, 51.3% of working-age persons with disabilities were employed in 2006 compared with 75.1% of their counterparts without disabilities (Statistics Canada, 2008a). The respective rates of employment for people with and without a disability were 40.3% vs. 69.9% in 1986, 48.2% vs. 72.9% in 1991 and 43.7% vs. 78.4% in 2001 (Roeher Institute, 1993; Statistics Canada, 1993 and 2003b). Yet only half of people with disabilities who are outside of the labour force say that their disability completely prevents them from working (Statistics Canada, 2008b) and many who feel completely prevented from working face social and economic barriers to obtaining employment.
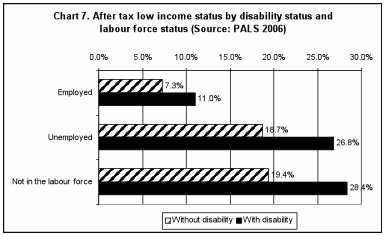
Their low level of employment helps explain the greater prevalence of poverty among people with disabilities. As Chart 7 shows, however, even where working, people with disabilities are more likely than people without to have low incomes (11% vs. 7.3%). Where not employed, i.e., where available for work or not in the labour force, the rates of low income among people with disabilities are about 1.5 times higher than for people without disabilities.
| Labor force status | Without disability | With disability |
|---|---|---|
| Employed | 7.3% | 11.0% |
| Unemployed | 18.7% | 26.8% |
| Not in the labour force | 19.4% | 28.4% |
Among people with disabilities living on low incomes, about one-third (33.4%) did not work in the 12 months before PALS was conducted and last worked before 2005 or never, compared with about a quarter (23.7%) of people without disabilities living on low incomes. And people with low incomes and disabilities who worked at some point in 2005 were about twice as likely to work part time for most of the year (40 to 48 weeks) than their counterparts without disabilities: 27% vs. 14.9%.
The type of workplace and whether it is unionized is associated with the income profile of people with disabilities. Among people with disabilities who are working, the rates of poverty are lowest for the 32.4% whose employers operate at more than one location and have 500 or more employees and for the 32.1% of the workforce with disabilities that is unionized or otherwise covered by a collective agreement. Employment with large employers where the workforce is unionized or otherwise covered by collective agreements would seem to be good hedges against low income; where both conditions are met the low-income rate for workers with disabilities is only (3.8%).[3] That said, however, only 18.4% of working people with disabilities are in such employment situations.
Unfortunately, PALS did not gather workplace-level information about people without disabilities so it is not possible to draw comparisons between the latter and people with disabilities.
Employment Discrimination
A robust theory of employment, low income status and disability would take into account discriminatory employment practices based on gender (Writh, 2002) and race/ethnicity (Statistics Canada, 2003a). It would also take into account public attitudes towards disability (Environics Research Group, 2004a, 2004b) and disability-specific discrimination (Finkelstein, 1993; Robert, 2003).
PALS is quite limited in that the employment discrimination it covers is specific to disability. The questions in the employment discrimination module (AEDI) asked, of people who had been active in the labour force at some point from 2001 through 2006, about being refused a job interview because of disability, being refused a job or a job promotion, being given less responsibility than co-workers, being denied a workplace accommodation, being paid less than other workers in similar jobs, being denied work-related benefits and being exposed to any other kind of employment discrimination. The time frame for when the discrimination occurred is "in the past five years". Analysis of the data found a significant difference in terms of low-income status by whether people did and did not report any of those forms of employment discrimination. Among people who indicate that they had experienced one or more forms of employment discrimination in the past five years, 22.4% are in low-income households while among those who have not had such an experience, 12.7%.[4]
B. Disability and Health-Related Characteristics
Attention now shifts to the disability and health-related characteristics of people who live in poverty. As PALS gathered this information concerning people with disabilities only, it is not possible to compare their situation with that of people without disabilities. Accordingly, the comparisons that are shown are generally between people with disabilities who do vs. do not live on low incomes.
Type of Disability
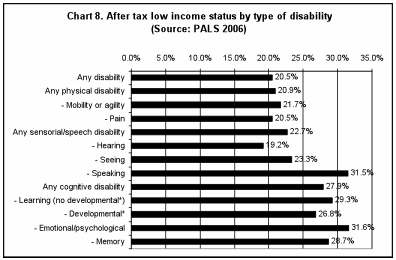
Regardless of type of disability, poverty rates are high compared with the rate for people without disabilities (Chart 8). However, people with disabilities in the area of spoken communication and in the broadly defined 'cognitive' domain (i.e., learning, developmental/intellectual, emotional/psychological and memory) are about 1.5 times higher than for people with any disability taken as a whole; the former rates are about three times higher than for people without a disability.
| Type of disability | Percentage |
|---|---|
| Any disability | 20.5% |
| Any physical disability | 20.9% |
| - Mobility or agility | 21.7% |
| - Pain | 20.5% |
| Any sensorial/speech disability | 22.7% |
| - Hearing | 19.2% |
| - Seeing | 23.3% |
| - Speaking | 31.5% |
| Any cognitive disability | 27.9% |
| - Learning (no developmental*) | 29.3% |
| - Developmental* | 26.8% |
| - Emotional/psychological | 31.6% |
| - Memory | 28.7% |
* People with a 'developmental' disability are increasingly referred to as people with an 'intellectual' disability.
Age at Disability Onset
Research has found that age at disability onset has a bearing on the labour force status of people with disabilities, with people acquiring disability early in life generally faring better in terms of employment prospects than people who become disabled after completing their formal schooling (Fawcett, 1996; Loprest & Maag, 2007). The present research found a similar pattern, with 52.6% vs. 42.1% being employed if becoming disabled, respectively, before rather than after completing formal studies. That pattern does not translate in a major way to low-income status, however. Among those who became disabled before completing formal studies, 22.3% live in low-income households compared with 19.5% whose disability occurred sometime after formal studies were finished.
Severity of Disability
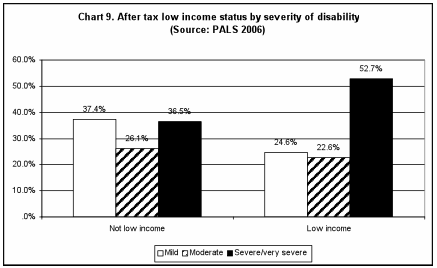
The likelihood of living on low household income increases with the severity of disability. The PALS measure of severity or degree of disability is a complex, composite measure that looks across broad domains of functioning (hearing, seeing, communicating and so on) and, so to speak, 'adds up' the cumulative amount of difficulty (some, a lot) that a given person experiences across all domains and in some cases (e.g., spoken communication, learning and psychological difficulties) the number of activities affected (a few, many, most) within the finer details of specific social contexts, such as with family, friends or others. Chart 9 shows that, among people with disabilities in low-income situations, more than half (52.7%) have a severe to very severe level of disability compared with only slightly more than a third (36.5%) of those who are not living in low-income households.
Bearing in mind that the poverty rate for people with disabilities is 20.5% overall, the rate for those with a severe to very severe level of disability is 27.3%. Among those with a mild and moderate degree of disability the rates are, respectively, 14.6% and 18.3%.
| Severity of disability | Not low income | Low income |
|---|---|---|
| Mild | 37.4% | 24.6% |
| Moderate | 26.1% | 22.6% |
| Severe/very severe | 36.5% | 52.7% |
Help with Everyday Activities
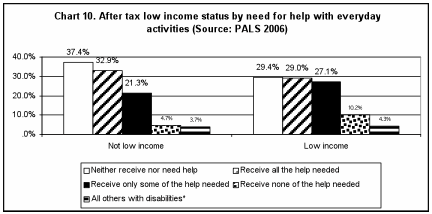
Table 10 and Chart 10 provide a look at where people are 'located' in terms of low income status by whether they need and receive help with everyday activities because of disability.
| Help received | Not low income | Low income | Not applicable | Total |
|---|---|---|---|---|
| Neither receive nor need help | 721,040 | 146,990 | 4,540 | 872,570 |
| Receive all the help needed | 635,750 | 144,740 | – | 781,490 |
| Receive only some of the help needed | 410,540 | 135,630 | – | 547,160 |
| Receive none of the help needed | 91,000 | 50,930 | – | 142,180 |
| All others with disabilities* | 71,960 | 21,670 | – | 94,220 |
| Total | 1,930,290 | 499,960 | 7,360 | 2,437,610 |
* 'All others with disabilities' are respondents for whom there are missing data about help needed or received.
These activities are preparing meals, everyday housework, heavy household chores, getting to appointments and running errands, (e.g., shopping for groceries), personal finances (e.g., banking or paying bills), child care due to disability (for people with children younger than 15 who live in the same household), personal care (e.g., washing, dressing or taking medication), in-home specialized nursing care or medical treatment (e.g., injections, therapy, blood, urine testing or catheter care) and moving about within the personal residence. Chart 10 shows that, compared with people who are not in low-income households, those living on low incomes are less likely to indicate that they need no such help (29.4% vs. 37.4%. respectively). The finding makes intuitive sense given the comparatively greater severity of disability among people in low-income households. Those in low-income households are more likely to indicate that they receive only some of the help they need (27.1% vs. 21.3%) or none of the help needed (10.2% vs. 4.7%).
| Help received | Not low income | Low income |
|---|---|---|
| Neither receive nor need help | 37.4% | 29.4% |
| Receive all help needed | 32.9% | 29.0% |
| Receive only some of help needed | 21.3% | 27.1% |
| Receive none of help needed | 4.7% | 10.2% |
| All others with disabilities* | 3.7% | 4.3% |
* All others with disabilities are respondents for whom there is no information about help needed or received.
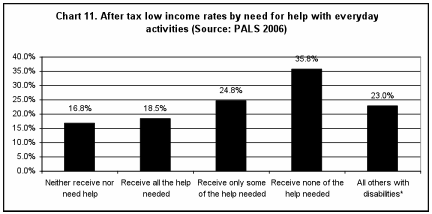
Chart 11 provides low-income rates by status of need for help with everyday activities. It shows that those who receive only some or none of the help needed are most likely to be in low-income households (24.8% and 35.8%, respectively). It should be borne in mind that those who are in low-income households and receive none of the help needed make up a small proportion of the working-age population with disabilities (2%).
| Help received | Low Income |
|---|---|
| Neither receive nor need help | 16.8% |
| Receive all the help needed | 18.5% |
| Receive only some of help needed | 24.8% |
| Receive none of help needed | 35.8% |
| All others with disabilities | 23.0% |
Self-reported General Health
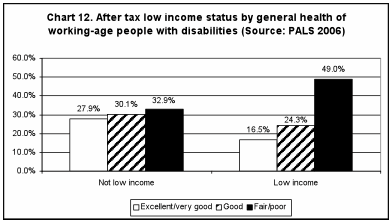
The self-reported general health of people with disabilities tends to be poorer where they are in low-income situations. Chart 12 shows that nearly half (49%) of people with disabilities and low incomes report their general health as fair or poor, compared with only about a third (32.9%) who are not in low-income households.
| General health | Not low income | Low incomie |
|---|---|---|
| Excellent/very good | 27.9% | 16.5% |
| Good | 30.1% | 24.3% |
| Fair/poor | 32.9% | 49.0% |
Self-reported Stress
Given the comparatively high level of poverty among people with disabilities, and, among people with disabilities and low incomes, the more severe levels of disability, poorer health, greater extent of unmet need for help with everyday activities, lower levels of employment and many other difficulties, it is perhaps to be expected that they would be feeling more 'stressed out' than people with disabilities who are not in low-income households. While this is true, the differences are not major, with 38.5% in low-income households feeling 'quite a bit' or 'extremely' stressed compared with 34.1% who are not in low-income households. If nothing else this finding points to the emotional resilience of people with disabilities who live on low incomes.
V. Summary of Findings, Conclusion and Next Steps
Overall, people with disabilities are twice as likely as people without to be living on low household incomes. In Quebec they are 2.7 times more likely and, respectively in Newfoundland and Labrador and Prince Edward Island, 2.5 and 2.3 times more likely. People with disabilities who live in rural communities, however, are half as likely as their urban counterparts to live in poverty. Somewhat surprisingly, there are no major differences in the extent to which women vs. men with disabilities live on low incomes, with women being only slightly more likely to be in low-income households. The high rate of poverty among people with disabilities remains high throughout the working years, but drops significantly and remains low in the retirement years. Government transfers for seniors, notably the Old Age Security, Guaranteed Income Supplement and Canada Pension Plan retirement benefits, as well as tax measures and drug and benefit plans, would seem to play an important role in reducing the rate of poverty among seniors with disabilities. Aboriginal persons with disabilities are much more likely than people who are neither from visible minorities nor Aboriginal persons to live in poverty. Rates of low income are very high among lone parents with disabilities and among people with disabilities who live alone or with unrelated others. Those with disabilities who live in low-income households are disproportionately more likely than their non-disabled counterparts to live in dwellings that are in need of major repairs.
As the level of formal educational certification increases, the extent of poverty among people with disabilities decreases. Higher educational attainment, however, does not remove the likelihood of poverty among people with disabilities, which remains considerably higher than for people without disabilities irrespective of level of educational certification. Those who have access to work-related training are much less likely to be living on low household incomes than people who have not received such training.
Even where working, people with disabilities are more likely than people without to have low incomes. Where they are unemployed or not in the labour force, the rates of low income among people with disabilities are higher still. About a third of people with disabilities who live on low household incomes last worked over a year ago or have never worked.
Among those who are working, the rates of poverty are lowest where the employer operates at more than one location, has 500 or more employees and where the workforce is unionized or otherwise covered by a collective agreement. Only about a fifth of workers with disabilities are in such employment situations.
People who have recently been active in the labour force and who consider that they have been discriminated against in employment because of disability are nearly twice as likely to be in low-income households as people who do not believe they have been subjected to employment discrimination.
Rates of low income for people with disabilities in the area of spoken communication and in the broadly defined 'cognitive' domain (i.e., learning, developmental/intellectual, emotional/psychological and memory) are about 1.5 times higher than for people with any disability taken as a whole and about three times higher than for people without a disability. The likelihood of living on low household income increases with the severity of disability. Among people with disabilities in low-income situations, more than half have a severe to very severe level of disability compared with only slightly more than a third of those who are not living in low-income households. People with disabilities who are in low-income households are more likely to indicate that they need help with everyday activities because of disability and that they receive only some or none of the help they require. More than half of people with disabilities and low incomes report that their general health is only fair or poor compared with about a third who are not in low-income households. However, despite the many challenges they face, the former are only slightly more likely than those who are not in low-income households to report feeling quite a bit or extremely stressed.
Arguably, a robust theory of employment and disability has been needed to guide analysis, public policy development and public investments with respect to the employment and adequate standard of living of people with disabilities. In the absence of robust theory, politicians and government officials have been without clear rationale for believing that any one factor or set of factors is more determinative than others in contributing to or hampering the employment of people with disabilities. Consequently, a compelling case has been lacking for making investments at all in the area,[5] let alone for making investments in one type of program intervention rather than another. Indeed, it is possible that Labour Market Agreements for Persons with Disabilities could get 'swallowed up' by recently signed Labour Market Agreements (LMAs) (HRSDC, 2009), which will focus on the employment of an eclectic mix of disadvantaged people who do not qualify for Employment Insurance (EI) and EI-based employment programming. The result could turn out to be the further de-prioritization of persons with disabilities in the competition for scarce resources under the LMAs.[6] In the absence of more fulsome policy and program efforts on the employment front, it remains to be seen whether provincial and territorial poverty reduction strategies will be able do what programming for seniors seems able to do to close the income breach disproportionately experienced by people with disabilities.
A next step in this stream of the statistical research for the Community-University Research Alliance is to summarize key findings of regression analysis conducted by the present author that identifies factors most strongly predictive of people with disabilities being outside of the labour force. Another step is to conduct new regression analysis to identify factors examined in the present paper that are most strongly predictive of people with disabilities being in situations of low household income. In both cases the aim will be to draw attention to policy and program factors that stand the greatest likelihood of helping people with disabilities move out of poverty into income adequacy – of disabling poverty and enabling citizenship.
VI. References
- Auditor General of Canada. (1999: 6-29). Report of the Auditor General of Canada – April 1999. Chapter 6. Ottawa: Author.
- Barnes, C. (2003). Disability, the organization of work, and the need for change. (Statement presented to the Organization for Economic Cooperation and Development Conference 'Transforming disability into ability', March 6 2003). Stockholm-Johanneshov: Independent Living Institute.
- Beatty, H. (1998). Comparison of Disability-Specific Social Assistance Programs in Alberta, British Columbia and Ontario. Winnipeg: Council of Canadians with Disabilities.
- Brooks, B. (2005). Chronic Unemployment: A Statistical Profile. Ottawa: Minister of Industry.
- Brown, D. (2002). The role of work and cultural values in occupational choice, satisfaction and success: A theoretical statement. Journal of Counselling & Development, 80(1), 48-56.
- Campbell, F.A.K. (2008). Exploring internalized ableism using critical race theory. Disability & Society, 23(2), 151-162.
- Canada Employment Insurance Commission. (1999). Employment Insurance 1999 monitoring and assessment report. Ottawa: Author. Annex 3.9.
- Canada Employment Insurance Commission. (2007). Employment Insurance monitoring and assessment report 2007. Annex 3.8. Retrieved May 23, 2009 from http://www.hrsdc.gc.ca/eng/employment/ei/reports/eimar_2007/annex/table3_8.shtml.
- Canada. Federal Task Force on Disability Issues. (1996). Equal citizenship for Canadians with disabilities: The will to act. Ottawa: Author.
- Canada. Office for Disability Issues. (2003). Advancing the inclusion of persons with disabilities. Ottawa: Author.
- Canadian Association for Community Living. (2006). From values to action: Building a community living movement for a decade of change. Toronto: Author.
- Canadian Association for Community Living. (2009). National report card 2009: Inclusion of Canadians with intellectual disabilities. Toronto: Author.
- Comfort, D., Johnson, K., & Wallace, D. (2003). Part-time work and family-friendly practices in Canadian workplaces. Ottawa: Statistics Canada and Human Resources Development Canada.
- Committee on Economic, Social and Cultural Rights [CESCR]. (6 February 2006). General Comment 18, Article 6: the equal right of men and women to the enjoyment of all economic, social and cultural rights. Thirty-fifth session. Doc. E/C.12/GC/18. Geneva: Economic and Social Council.
- Council of Canadians with Disabilities. (Various dates). Annual Report for 2002-2003, 2003-2004, 2004-2005, 2005-2006,2006,2007, 2007-2008, 2008-2009. Winnipeg: Author.
- Eardley (2002). Identifying and quantifying the costs of unemployment. In R. Taylor and P. Saunders (Eds.), The price of prosperity: The economic and social costs of unemployment (pp. 44-64). Sydney: UNSW Press.
- Environics Research Group (April 2004). Canadian attitudes towards disability issues: 2004 benchmark survey – final report. Toronto: Author.
- Environics Research Group (March 2004). Canadian attitudes toward disability issues: a qualitative study – final report. Toronto: Author.
- Fawcett, G. (1996). Living with disability in Canada: An economic portrait. Ottawa: Human Resources Development Canada, Office for Disability Issues.
- Fawcett, G. (2000). Bringing down the barriers: The labour market and women with disabilities in Ontario. Ottawa: Canadian Council on Social Development.
- Federal-Provincial-Territorial Directors of Income Support. (2005). Social assistance statistical report – 2004. Ottawa: Social Development Canada, Social Programs Analysis Division.
- Finkelstein, V. (1993). The commonality of disability. In J. Swain, V. Finkelstein, S. French & M. Oliver (Eds.), Disabling barriers, enabling environments (pp. 9-16). London: SAGE Publications.
- Galarneau, D., & Radulescu, M. (May 2009). Perspectives. Ottawa: Statistics Canada.
- Government of Canada. (2008). 2008 federal disability report: Advancing the inclusion of persons with disabilities. Ottawa: Author.
- Health Canada. (2002). The economic burden of illness in Canada, 1998. Ottawa: Minister of Public Works and Government Services Canada.
- Hogansen, J. M., Powers, K., Geenen, S., Gill-Kashiwabara, E., & Powers, L. E. (2008). Transition goals and experiences of females with disabilities: Youth, parents and professionals. Exceptional Children, 74(2), 215-234.
- Human Resources Development Canada. (2003). Disability in Canada: A 2001 profile. Ottawa: Author.
- International Labour Office. (2004). Breaking the glass ceiling: Women in management. Update 2004. Geneva: Author.
- Johnson, R.W., & Sasso, A.T. (2006). The impact of elder care on women's labour supply. Inquiry, 43(3), 195-210.
- Kapsalis, C. & Tourigny, P. (2007). Profiles and transitions of groups most at risk of social exclusion. Report prepared for Social Development Canada. Ottawa: Data Probe Economic Consulting Inc.
- Kuhn, P. (2003). Effects of population aging on labour market flows in Canada: analytical issues and research priorities. Santa Barbara: University of California.
- Loprest, P. & Maag, E. (2007). The relationship between early disability onset and education and employment. Journal of Vocational Rehabilitation, (26)1, 49-62.
- National Council of Welfare. (2008). Welfare incomes, 2006 and 2007. Ottawa: Author.
- Office of the High Commissioner for Human Rights. (1994). Persons with Disabilities. General Comment 5. Geneva: Author.
- Oliver, M. (1990). The Politics of Disablement. Houndmills, Basingstoke, Hampshire and London: MacMillan Education Ltd.
- Pamela Robert. (2003). Disability oppression in the contemporary U.S. capitalist workplace. Science and Society, 67(2), 136-159.
- Parker, S. (2008). Equality through difference: Political values and policy responses to disability in liberal welfare regimes. Presentation Paper, Social Policy Association Conference, Edinburgh, June 23-26.
- Parliamentary Special Committee on the Disabled and the Handicapped, (1981). Obstacles. Ottawa: Minister of Supply and Services Canada.
- Roeher Institute. (1993). On Target? Canada's employment-related programs for persons with disabilities. North York: Author.
- Roeher Institute. (2004). Improving the odds: Employment, disability and public programs in Canada. North York, Ont.
- Roulstone, A. (2002). Disabling Pasts, Enabling Futures? How Does the Changing Nature of Capitalism Impact on the Disabled Worker and Jobseeker? Disability and Society, (17)6, 627-642.
- Stapleton, D.C., & Burkhauser, R.V. (2003). The decline in employment of people with disabilities. Kalamazoo, MI: W.E. Upjohn Institute.
- Statistics Canada. (1993). Adults with disabilities: Their employment and education characteristics – 1991 Health and Activity Limitation Survey. Ottawa: Minister of Industry, Science and Technology.
- Statistics Canada. (2003a). Ethnic Diversity Survey. The Daily. Monday, September 29. Retrieved May 24, 2009 from http://www.statcan.gc.ca/daily-quotidien/030929/dq030929a-eng.htm.
- Statistics Canada. (2003b, 2006 revision). Participation and Activity Limitation Survey 2001: Education, employment and income of adults with and without disabilities. Tables. Ottawa: Minister of Industry.
- Statistics Canada. (2008a). Participation and Activity Limitation Survey 2006: Labour Force Experience of People with Disabilities in Canada. Ottawa: Minister of Industry.
- Statistics Canada. (2008b). Participation and Activity Limitation Survey 2006: Tables III. Ottawa: Minister of Industry.
- Statistics Canada. (2008c). Low income before-tax cut-offs. Retrieved May 27, 2010 from http://www12.statcan.ca/census-recensement/2006/ref/dict/fam020-eng.cfm.
- Statistics Canada. (2009a). Low income measures. Retrieved May 27, 2010 from http://www.statcan.gc.ca/pub/75f0011x/2009001/def/low-faible-eng.htm.
- Statistics Canada. (2009b). Table 326-0021. Consumer price index (CPI), 2005 basket, annual (2002=100). Retrieved May 23, 2009 from http://cansim2.statcan.gc.ca/cgi-win/cnsmcgi.pgm#TFtn
- Statistics Canada. (2009c). Participation and Activity Limitation Survey public use microdata file user guide. Ottawa: Minister of Industry.
- Statistics Canada. (2010). More information on low income after-tax cut-offs (LICO-AT). Retrieved May 27, 2010 from http://www12.statcan.ca/census-recensement/2006/ref/dict/fam019a-eng.cfm.
- Sub-Committee on The Status of Persons With Disabilities of the Standing Committee on Human Resources Development and the Status of Persons with Disabilities. (Wednesday, May 16, 2001). Evidence. Ottawa: Author. Retrieved May 26, 2010 from http://www2.parl.gc.ca/HousePublications/Publication.aspx?Language=E&Mode=1&Parl=37&Ses=1&DocId=1040830&File=0
- Timpson, A.M. Driven apart: Women's employment equality and child care in Canadian public policy. Vancouver: UBC Press.
- United Nations. (2006). Convention on the Rights of Persons with Disabilities and Optional Protocol. Geneva: Author.
- United Nations. (2010). Convention and Optional Protocol Signatures and Ratifications. Retrieved June 10, 2010 from http://www.un.org/disabilities/countries.asp?id=166#C
- Warwick Institute for Employment Research & Economix Research & Consulting. (2006). Ageing and employment: Identification of good practice to increase job opportunities and maintain older workers in employment – Final report. Brussels: European Commission, Directorate-General for Employment, Social Affairs and Equal Opportunities
- Writh, L. (4 February 2002). Breaking through the glass ceiling: Women in management. First International Conference, Pay Equity between Women and Men: Myth or Reality? Geneva: International Labour Office.
- [1] Owing to low count cells, the data for Prince Edward Island and New Brunswick were merged in order to meet Statistics Canada's data release requirements.
- [2] The questions on training were not asked where of respondents who had not been active in the labour force at any point from 2001 through 2006 or where survey respondents were proxies for people with disabilities, e.g., non-disabled family members.
- [3] The figure should be treated with caution owing to the small number of people with disabilities to whom the estimate applies.
- [4] In the general discrimination module (ADIS), question ADIS_Q03 in effect enquired about whether non-proxy respondents had ever felt they had been treated unfairly "[a]t work or when applying for a job or promotion" because of disability. In that a person could have felt that way about an incident that happened many years ago or yesterday and that no details about the incident were captured, interpreting the meaning of 'yes' responses is problematic. Accordingly, this variable was not used in the present research.
- [5] The Auditor General of Canada (1999: 6-29) pointed out the gap in knowledge about "what works and what does not work" in terms of program measures funded under the EAPD. However, employment programming for persons with disabilities was hardly new; it had been funded under VRDP since 1961.
- [6] Senior official, Government of Newfoundland and Labrador, confidential personal communication, February 23, 2009.

End Exclusion supporters rally in support of an accessible and inclusive Canada.
