Cameron Crawford
Institutes for Research and Development on Inclusion and Society (IRIS)
December 2, 2014
A key problem for people with disabilities
-
Poverty
-
Associated with a range of socio-demographic characteristics
-
Including labour force status (esp. non-participation)
-
Also associated with ‘positioning’ in terms of access to and participation in various kinds of public programmings, e.g.,
-
Education
-
Training
-
This income program vs. that income program
This presentation is based on two reports done for CCD:
Who are we talking about?
-
People who say they have any difficulty hearing, seeing, communicating, walking, climbing stairs, bending, learning or doing any similar activities, and/or
-
People who say they have a physical condition, mental condition or health problem that reduces the amount or kind of activity they can do in any of the following:
-
At home
-
At school or work
-
In other activities (e.g., transportation, leisure)
Who are we talking about?
-
People who said ‘yes’ to any of those questions on Statistics Canada’s Participation and Activity Limitation Survey (PALS) of 2006 and on the Survey of Labour and Income Dynamics (SLID) 2009 are flagged as having a ‘disability’
-
Others are flagged as not having a disability
-
PALS was Statistics Canada’s ‘flagship’ survey on disability. SLID was a major survey on income and employment.
Who are we talking about?
-
Working-age people (15 to 64 years in PALS, 16 to 64 years in SLID)
-
2.4 million working-age people with disabilities in PALS
-
18.7 million working-age people without disabilities in PALS
-
People whose household incomes fall below the Low Income Cut-Off (LICO)
What’s the LICO?
-
Basically, it’s where a household spends 20% or more of its income than the average for similar households for food, shelter and clothing
-
There is a before-tax and after-tax LICO
-
I’m using the after-tax LICO because it takes into account tax credits that can leave a little more cash in people’s pockets
-
People living on incomes below the LICO are sometimes said to be living below the “poverty line”
Overall…
-
Nearly 600,000 Canadian adults 15 years and older with disabilities have incomes below the LICO (PALS)
-
However, this presentation focuses on working-age people (15 to 64 years)
-
Nearly 500,000 with disabilities and incomes below the LICO (PALS)
-
More than 900,000 based on SLID 2009 (about 4%)
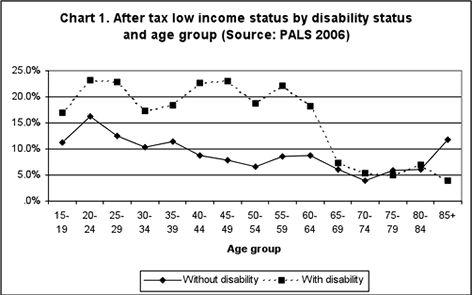
Why only working-age people?
-
The low income rates for seniors with and without disabilities are very similar and are generally lower than for working-age people
-
There are large numbers of seniors with disabilities
-
To have included seniors would have ‘understated’ the extent of low income among people with disabilities
Why only working-age people?
After tax low income status by disability status and age group (Source: PALS 2006)
|
Age Group |
Without disability |
With disability |
|
15-19 |
11.3% |
17.0% |
|
20-24 |
16.3% |
23.2% |
|
25-29 |
12.5% |
22.9% |
|
30-34 |
10.3% |
17.4% |
|
35-39 |
11.4% |
18.3% |
|
40-44 |
8.7% |
22.7% |
|
45-49 |
7.9% |
23.0% |
|
50-54 |
6.6% |
18.8% |
|
55-59 |
8.5% |
22.1% |
|
60-64 |
8.8% |
18.3% |
|
65-69 |
6.0% |
7.3% |
|
70-74 |
4.0% |
5.4% |
|
75-79 |
5.9% |
4.9% |
|
80-84 |
6.0% |
7.0% |
|
85+ |
11.8% |
3.9% |
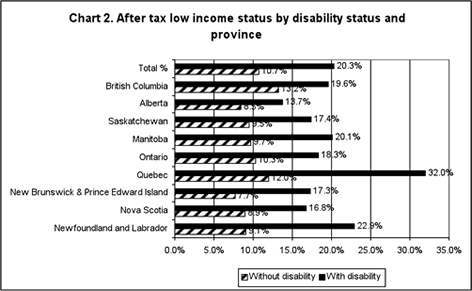
High poverty rates among people with disabilities in Newfoundland & Labrador and Quebec
(Source: PALS 2006)
After tax low income status by disability status and province
|
|
Without disability |
With disability |
|
Total % |
10.7% |
20.3% |
|
British Columbia |
13.2% |
19.6% |
|
Alberta |
8.5% |
13.7% |
|
Saskatchewan |
9.5% |
17.4% |
|
Manitoba |
9.7% |
20.1% |
|
Ontario |
10.3% |
18.3% |
|
Quebec |
12.0% |
32.0% |
|
New Brunswick & Prince Edward Island |
7.7% |
17.3% |
|
Nova Scotia |
8.9% |
16.8% |
|
Newfoundland and Labrador |
9.1% |
22.9% |
Gender by itself is not a major predictor of low income among people with disabilities
-
Poverty rates among working-age people with disabilities
-
Women (21.3%)
-
Men (19.6%)
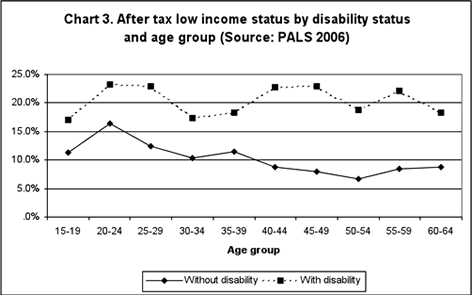
Regardless of age up to 65 years, people with disabilities about twice as likely to be in poverty
After tax low income status by disability status and age group (Source: PALS 2006)
|
Age Group |
Without disability |
With disability |
|
15-19 |
11.3% |
17.0% |
|
20-24 |
16.3% |
23.2% |
|
25-29 |
12.5% |
22.9% |
|
30-34 |
10.3% |
17.4% |
|
35-39 |
11.4% |
18.3% |
|
40-44 |
8.7% |
22.7% |
|
45-49 |
7.9% |
23.0% |
|
50-54 |
6.6% |
18.8% |
|
55-59 |
8.5% |
22.1% |
|
60-64 |
8.8% |
18.3% |
|
65-69 |
6.0% |
7.3% |
|
70-74 |
4.0% |
5.4% |
|
75-79 |
5.9% |
4.9% |
|
80-84 |
6.0% |
7.0% |
|
85+ |
11.8% |
3.9% |
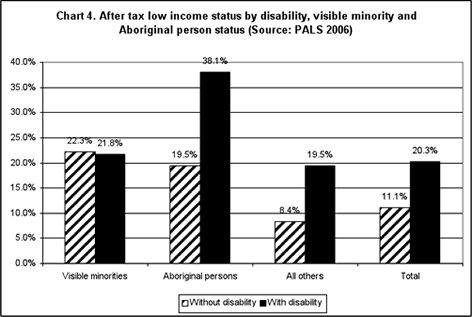
Very high poverty rate among Aboriginal persons with disabilities
After tax low income status by disability, visible minority and Aboriginal person status (Source: PALS 2006)
|
|
Without disability |
With disability |
|
Visible minorities |
22.3% |
21.8% |
|
Aboriginal persons |
19.5% |
38.1% |
|
All others |
8.4% |
19.5% |
|
Total |
11.1% |
20.3% |
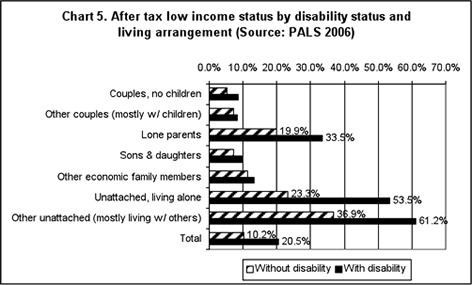
Highest poverty rates where people with disabilities are ‘unattached’ or lone parents
After tax low income status by disability status and living arrangement (Source: PALS 2006)
|
|
Without disability |
With disability |
|
Couples, no children |
5.2% |
8.7% |
|
Other couples (mostly w/ children) |
7.2% |
8.2% |
|
Lone parents |
19.9% |
33.5% |
|
Sons & daughters |
7.1% |
9.6% |
|
Other economic family members |
11.3% |
13.2% |
|
Unattached, living alone |
23.3% |
53.5% |
|
Other unattached (mostly living w/ others) |
36.9% |
61.2% |
|
Total |
10.2% |
20.5% |
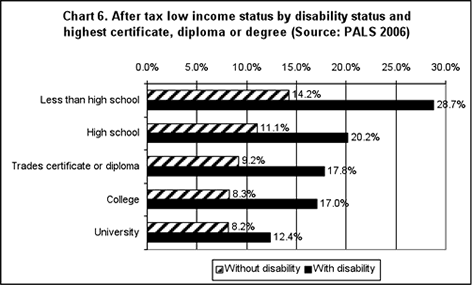
Highest poverty rate where people have less than high school graduation
After tax low income status by disability status and highest certificate, diploma or degree (Source: PALS 2006)
|
|
Without disability |
With disability |
|
Less than high school |
14.2% |
28.7% |
|
High school |
11.1% |
20.2% |
|
Trades certificate or diploma |
9.2% |
17.8% |
|
College |
8.3% |
17.0% |
|
University |
8.2% |
12.4% |
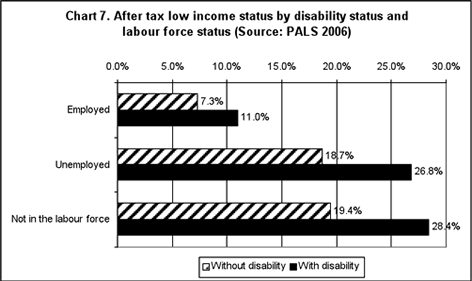
High poverty rates where people are not working for pay
After tax low income status by disability status and labour force status (Source: PALS 2006)
|
|
Without disability |
With disability |
|
Employed |
7.3% |
11.0% |
|
Unemployed |
18.7% |
26.8% |
|
Not in the labour force |
19.4% |
28.4% |
Type of workplace
-
Poverty rates lowest where people are working for employers that are large (500+ employees), operate at more than one location and that are unionized
Employment discrimination
-
Among people active in the labour force in the past 5 years, those who have experienced employment discrimination in that time frame are nearly twice as likely to be living in low income households (22.4% vs. 12.7%)
-
Includes, because of disability, perception of being refused a job interview, a job or job promotion, work-related benefits, or being given less pay than workers in similar jobs or being given less responsibility
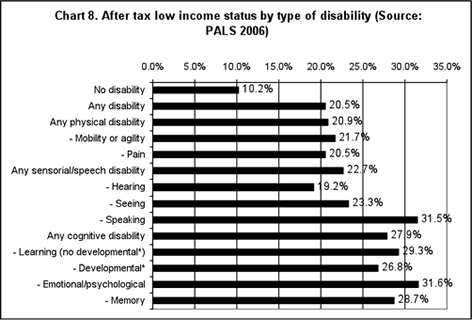
Poverty rates tend to be higher where people have a cognitive or spoken communication disability
After tax low income status by type of disability (Source: PALS 2006)
|
No disability |
10.2% |
|
Any disability |
20.5% |
|
Any physical disability |
20.9% |
|
- Mobility or agility |
21.7% |
|
- Pain |
20.5% |
|
Any sensorial/speech disability |
22.7% |
|
- Hearing |
19.2% |
|
- Seeing |
23.3% |
|
- Speaking |
31.5% |
|
Any cognitive disability |
27.9% |
|
- Learning (no developmental*) |
29.3% |
|
- Developmental* |
26.8% |
|
- Emotional/psychological |
31.6% |
|
- Memory |
28.7% |
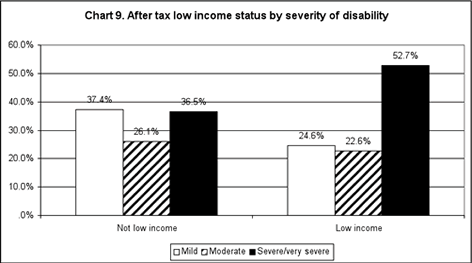
People with a severe to very severe level of disability are over-represented among people in poverty
(Source: PALS 2006)
After tax low income status by severity of disability
|
|
Mild |
Moderate |
Severe/very severe |
|
Not low income |
37.4% |
26.1% |
36.5% |
|
Low income |
24.6% |
22.6% |
52.7% |
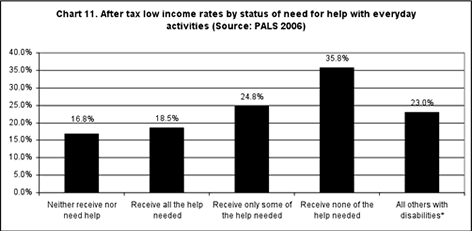
High rates of poverty among people needing more help with everyday activities
After tax low income rates by status of need for help with everyday activities (Source: PALS 2006)
|
|
Not low income |
Low income |
|
Neither receive nor need help |
37.4% |
29.4% |
|
Receive all the help needed |
32.9% |
29.0% |
|
Receive only some of the help needed |
21.3% |
27.1% |
|
Receive none of the help needed |
4.7% |
10.2% |
|
All others with disabilities* |
3.7% |
4.3% |
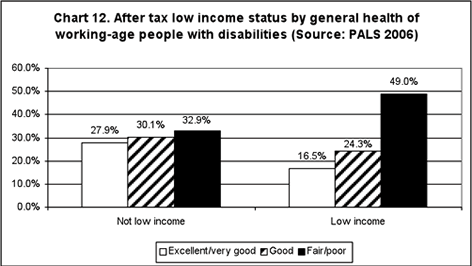
People with disabilities and in poverty are more likely than those with higher incomes to be in fair or poor health
After tax low income status by general health of working-age people with disabilities (Source: PALS 2006
|
|
Not low income |
Low income |
|
Excellent/very good |
27.9% |
16.5% |
|
Good |
30.1% |
24.3% |
|
Fair/poor |
32.9% |
49.0% |
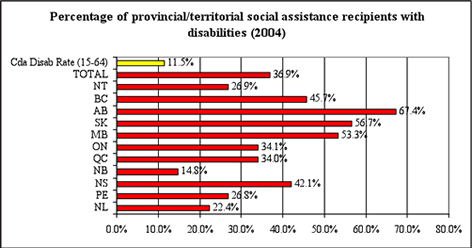
People with disabilities make up a large percentage of social assistance recipients
Percentage of provincial/territorial social assistance recipients with disabilities (2004)
|
|
Percent |
|
Cda Disab Rate (15-64) |
11.% |
|
TOTAL |
36.9% |
|
NT |
26.9% |
|
BC |
45.7% |
|
AB |
67.4% |
|
SK |
56.7% |
|
MB |
53.3% |
|
ON |
34.1% |
|
QC |
34.0% |
|
NB |
14.8% |
|
NS |
42.1% |
|
PE |
26.8% |
|
NL |
22.4% |
Source: Administrative data from the Federal-Provincial-Territorial Directors of Income Support. (2005). Social assistance statistical report – 2004. Ottawa: Social Development Canada, Social Programs Analysis Division.
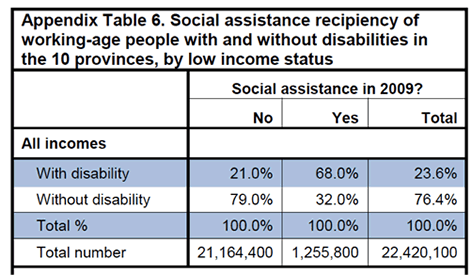
People with disabilities make up a large percentage of social assistance recipients
(Source: SLID 2009)
Social assistance recipiency of working-age people with and without disabilities in the 10 provinces, by low income status
|
|
Social assistance in 2009% |
|
No |
Yes |
Total |
|
All incomes |
|
|
With disability |
21.0% |
68.0% |
23.6% |
|
Without disability |
79.0% |
32.0% |
76.4% |
|
Total % |
100.0% |
100.0% |
100.0% |
|
Total number |
21,164,400 |
1,255,800 |
22,420,100 |
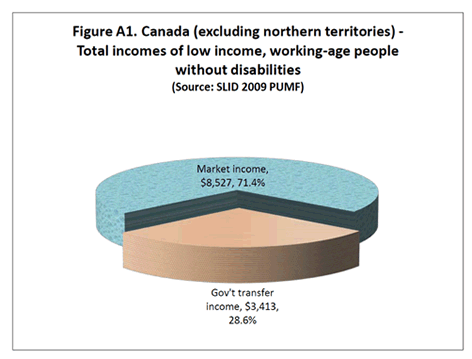
Market income (mainly employment) is the main source of income for poor people without disabilities
Canada (excluding northern territories) - Total incomes of low income, working-age people without disabilities (Source: SLID 2009 PUMF)
-
Market income
-
$8,527, 71.4%
-
Gov't transfer income
-
$3,413, 28.6%
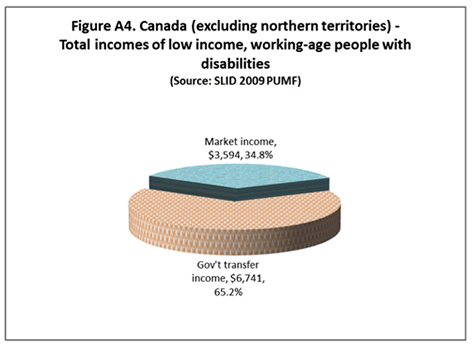
Gov’t transfer income (mainly social assistance) is the main source of income for poor people disabilities
Canada (excluding northern territories) - Total incomes of low income, working-age people with disabilities (Source: SLID 2009 PUMF)
-
Market income
-
$3,594, 34.8%
-
Gov't transfer income
-
$6,741, 65.2%
The picture varies by province, but incomes are very low overall for poor people with disabilities
-
Average incomes among working-age poor people with disabilities:
-
Highest in Alberta ($11,482), Ontario ($10,693) and Manitoba (10,532);
-
Lowest in New Brunswick ($7,771), Newfoundland and Labrador ($8,432) and Nova Scotia ($8,565).
Transfer income from gov’t makes up a very high percentage of all the income of poor people with disabilities in most provinces
-
Very high shares of transfer income and low shares of market income are notable in Quebec and the Atlantic provinces.
-
The most extreme variance from the national average is Newfoundland and Labrador:
-
Here, transfer income is 83.6% and market income is only 13.7%.
Summary
-
People with disabilities:
-
Twice as likely to be living in poverty and even more so in Quebec, Newfoundland and Labrador and Prince Edward Island
-
Remain more likely to be living in poverty across the working years, then the poverty rate falls roughly into line with non-disabled people after age 64
-
Government transfers seem to play a significant role in reducing the poverty rate among seniors with and without disabilities
Summary
-
Aboriginal people with disabilities much more likely than non-disabled to be living in poverty
-
Poverty rates high among lone parents and people living alone or with unrelated others
-
People with disabilities living in poverty disproportionately more likely in dwellings in need of major repairs
Summary
-
Poverty decreases with increases in the level of formal educational certification
-
Access to work-related training is associated with lower poverty
-
Poverty rates lowest where people are working, esp. with larger, multi-site, unionized employers
-
Poverty rate higher for those who have recently experienced employment discrimination
Summary
-
Poverty rates highest where
-
Disability is cognitive or involves difficulties with spoken communication
-
Degree of disability is more severe
-
There are unmet needs for help with everyday activities
A question:
-
People with disabilities often face serious challenges to employment that are beyond their personal control.
-
Why, then, in an affluent country such as Canada, are they left disproportionately reliant on social assistance programs that typically accord incomes that are well below the poverty line?