We Need Your Support
Donations are tax deductible and you will receive a charitable tax receipt for 100% of your gift.

Act Now

Empower U: Learn to Access Your Disability Rights Training on Canadian Human Rights, the Convention on the Rights of Persons with Disabilities (CRPD) and its Optional Protocol (OP) training aims to increase awareness of how to address discrimination using more familiar Canadian human rights laws such as Human Rights Codes and the newer international Convention on the Rights of Persons with Disabilities (CRPD). This is training for persons with disabilities by persons with disabilities. The training is part of a project funded by Employment and Social Development Canada and implemented by the Council of Canadians with Disabilities (CCD) in collaboration with Canadian Multicultural Disability Centre Inc. (CMDCI), Citizens With Disabilities – Ontario (CWDO), Manitoba League of Persons with Disabilities (MLPD) and National Educational Association of Disabled Students (NEADS). Read more.
The Fight Against Poverty and Exclusion in Québec: Mixed Results, Including for Persons with Disabilities
François Aubry
February 2012
Presentation
On December 13, 2002, the Government of Québec instituted, as part of a major law passed unanimously by the National Assembly, the Act to combat poverty and social exclusion (Bill 112), a strategy to reduce poverty and social exclusion.
This law, which made the fight against poverty and social exclusion an explicit priority of the Government of Québec, is the first legislation of its kind in North America. It introduces a National Strategy against poverty and social exclusion, which includes "a set of actions implemented by the Government, its socio-economic partners, regional and local community organizations and other stakeholders to fight poverty and promote social inclusion" (Government of Québec, 2002: 1). The law led to the establishment of five-year plans with a series of measures to fulfill its main objective, thereof to progressively make Québec, by 2013, one of the industrialized nations having the least number of persons living in poverty (Article 4 of the Bill).
In a previous text (Aubry, 2010), we described the popular mobilization that led to the adoption of this bill. We also examined the key features of Bill 112 and the main measures implemented within the first five-year action plan, by paying particular attention to measures for people with disabilities.
Although it is too early to pass final judgment on the success of the Québec strategy to fight against poverty and social exclusion, we will attempt in this paper to evaluate the progress made since the adoption of the law regarding the evolution of poverty and inequality in income distribution in Québec.
Our text is divided into three parts. First, we will study the data on the evolution of poverty in Québec, in other Canadian provinces and in major industrialized countries. Then, we will examine some general data on the evolution of inequality in income distribution in Québec, in other provinces and in major industrialized countries. Finally, in the third part, we will focus on the evolution of poverty for people with disabilities.
Methodological Considerations: a Risky Task
Any attempt to assess the current success of Bill 112, which aims to progressively make Québec, by 2013, one of the industrialized nations having the least number of persons living in poverty, is a perilous exercise because it faces several constraints.
First, poverty and social exclusion are "complex and multidimensional realities" (Noël, 2011) that can be grasped only by using some indicators of a financial nature (poverty rate and Gini coefficient), as suggested by the definition of poverty adopted by the legislator in Bill 112. Indeed, poverty is defined as "the condition of a human being who is deprived of resources, means, choices and power necessary to acquire and maintain economic self-sufficiency or to facilitate his integration and participation in society" (Government of Québec, 2002) Next, reaching the 2013 goal depends not only on the development of the Québec situation but also that of other industrialized societies. As emphasized by Noël (2011) "the 2013 objective is therefore a moving target that requires us to give a good hard look at others as well as at ourselves". However, international comparative data are few and are only available after a delay of several years. Data for 2013 will only be available in 2015 or 2016, at which time we will be able to achieve a more definitive assessment.
Finally, we need to be careful about the contribution of government policies in the fight against poverty and social exclusion. Indeed, the evolution of poverty in any society depends not only on public policies in the economic and social spheres; it is also dependent on economic cycles of expansion, slowdown and recession on which the public authorities of a single state have less and less influence, particularly since the acceleration of globalization and the internationalization of financial transactions. Thus, the significant decrease in the unemployment rate in Québec since the early 2000s has obviously contributed to the reduction of poverty, while the financial crisis of 2008 and the recession it spawned have contributed to its increase.
That said, even if we are unable to determine conclusively the success or failure of Québec's strategy to fight against poverty, we have enough information to consider at least whether Québec has been moving in the right direction since the adoption of Bill 112 with respect to its explicit objectives.
Part 1.
The Evolution of Poverty
Several statistical series exist on the evolution of poverty in Québec and Canada. The three most used sets are the Low Income Cut-Offs (LICO) before and after tax and the Low Income Measure (LIM) before and after tax from Statistics Canada[1] and the Market Basket Measure (MBM) developed by Human Resources and Skills Development Canada in the late 1990s and published annually by Statistics Canada since 2000.
The Low Income Cut-Offs from Statistics Canada consider a person to be low income if the person spends 20% more for goods considered as essential (housing, clothing and food) than the person whose income is equal to the Canadian average. Using these thresholds for interprovincial comparisons underestimates the low-income rates in high-income provinces (Ontario and Alberta, for example) and overestimates them in provinces with a lower average income (Québec and New Brunswick, for example) (Lanctôt and Fréchet, 2002). Unfortunately, thresholds adjusted to the reality of each province are published only sporadically.
The Low Income Measure is half the Canadian median income (before or after tax) of family units[2]. This relative measure takes account of the wealth of each country. For interprovincial comparisons, however, this indicator is not very accurate because it uses the median income for all of Canada and not for each province. Thus, the poverty rate in a province like Québec, whose median income is below the Canadian median income, will be overvalued, while the rate of a province like Ontario, whose median income is higher than the Canadian median, will be undervalued. The Institut de la statistique du Québec produces annual data on the Low Income Measure adjusted for Québec using this province median income.
When one wants to compare the situation of Canadian provinces, the Market Basket Measure (MBM) is more useful because it takes into account each province's wealth. It is an absolute poverty threshold because it indicates, for each province, the amount of income needed to purchase a set of essential goods and services, taking into account the price levels in each province. The weakness of this indicator is that it excludes a number of needs that go beyond mere survival, but are essential to participation in social life. Finally, the MBM cannot be used for international comparisons because this indicator exists only in Canada.
None of these indexes is perfect; each has its advantages and disadvantages and the use of one or the other will depend on research objectives. When one wants to compare the situation between provinces, the Market Basket Measure is more useful, but for international comparisons, the after-tax Low Income Measure is more useful, this indicator being used by international agencies.
Poverty Rate in Québec
We will first present the evolution of the poverty rate in Québec according to the MBM for individuals depending on different types of households from 2000 to 2008. Then we will present the evolution of this indicator for all Canadian provinces for the same period. Finally, we will use the after-tax Low Income Measure in order to compare how the situation has changed in Canada and Québec in comparison with other industrialized countries.
Table 1 shows the evolution of the poverty rate in Québec from 2000 to 2008 using the method of the Market Basket Measure for all individuals.
| 2000 | 2001 | 2002 | 2003 | 2004 | 2005 | 2006 | 2007 | 2008 | |
|---|---|---|---|---|---|---|---|---|---|
| % | |||||||||
| All individuals | 11.6 | 11.5 | 10.3 | 9.2 | 8.4 | 8.9 | 9.0 | 8.2 | 9.5 |
| Sex | |||||||||
| Men | 10.5 | 10.6 | 9.4 | 8.9 | 8.5 | 8.8 | 9.0 | 8.1 | 9.3 |
| Women | 12.7 | 12.3 | 11.1 | 9.6 | 8.2 | 9.0 | 9.1 | 8.2 | 9.7 |
| Types of families | |||||||||
| Single people | 25.4 | 25.9 | 21.8 | 21.5 | 22.1 | 24.6 | 23.4 | 22.7 | 22.8 |
| People with family | 9.1 | 8.8 | 8.1 | 6.8 | 5.6 | 5.7 | 6.0 | 5.0 | 6.6 |
| Couples without children | 6.0 | 6.6 | 6.9 | 6.0 | 5.0 | 5.3 | 5.2 | 5.3 | 5.1 |
| Couples with children | 6.7 | 8.1 | 5.6 | 4.5 | 3.6 | 4.7 | 4.4 | 3.1 | 6.3 |
| Single-parent families | 31.8 | 26.6 | 25.6 | 23.9 | 21.3 | 18.1 | 20.3 | 16.5 | 19.8 |
| Children (0-17 years) | 13.7 | 13.2 | 10.7 | 8.8 | 7.5 | 7.5 | 7.3 | 5.8 | 9.2 |
| Adults (18 years and older) | 11.0 | 11.0 | 10.2 | 9.4 | 8.6 | 9.3 | 9.5 | 8.7 | 9.6 |
| 18-64 years | 12.7 | 12.7 | 11.6 | 10.8 | 10.0 | 10.8 | 11.0 | 10.1 | 11.3 |
| 65 years and over | 1.8 | 1.9 | 2.3 | 1.7 | 1.5 | 1.5 | 1.6 | 2.0 | 1.9 |
Source: Statistics Canada, Survey of Labour and Income Dynamics (2000-2008). Compilation: Institut de la statistique du Québec.
From this table, we can make the following observations:
- The general trend is a gradual decrease in the poverty rate throughout the period, with the exception of 2008, characterized by a severe financial crisis and a recession;
- The poverty rate for women has experienced a faster decline than the one for men during this period;
- Among all households, it is in families that the incidence of poverty declined the most, from 9.1% in 2000 to 5% in 2007, then increasing to 6.6% in 2008;
- Although the poverty rate declined by about half in single-parent families, from 31.8% in 2000 to 16.5% in 2007, then increasing to 19.8% in 2008, the incidence of poverty remains very high for these families, particularly those headed by a woman;
- Single people, especially those who do not hold jobs, were left behind during the period since they continually suffer from a high poverty rate. Although Table 1 does not distinguish individuals with employment from those who are unemployed, it is the latter whose poverty rate increased during this period (CEPE, 2008);
- For the elderly, the poverty rate changed little over the period, remaining at a relatively low level. These data, however, hide significant differences between men and women aged 65 and over, the latter having an incidence of poverty much higher than that of men. The trends noted above reflect the objectives of the first Government action plan, which were primarily to improve the lot of families, especially those with children (child benefits, low-cost child care, parental leave, etc.) and low-income individuals with jobs (work premium, increase of the minimum wage, the Employment Pact, etc.).
Québec in Canada
In this section, we compare the evolution of the poverty rate of Québec with that of other provinces and that of Canada from 2000 to 2008. Table 2 presents the evolution of the low-income rate according to the MBM for each province and for all Canada. It also presents the percentage variation from 2000 to 2007; the year 2008 was dismissed because of the significant effects of the recession on the general trend.
| 2000 | 2001 | 2002 | 2003 | 2004 | 2005 | 2006 | 2007 | 2008 | 2000-2007 | |
|---|---|---|---|---|---|---|---|---|---|---|
| % | ||||||||||
| Provinces | ||||||||||
| Newfoundland and Labrador | 20.5 | 17.1 | 17.8 | 15.6 | 17.0 | 14.2 | 14.6 | 11.1 | 12.7 | -45.9 |
| Prince Edward Island | 14.6 | 14.3 | 12.8 | 11.0 | 10.3 | 10.2 | 11.6 | 9.1 | 10.0 | -37.7 |
| Nova Scotia | 14.2 | 14.3 | 14.2 | 14.4 | 12.6 | 11.8 | 11.0 | 12.0 | 12.5 | -15.3 |
| New Brunswick | 13.7 | 12.9 | 13.9 | 13.3 | 12.6 | 13.1 | 14.0 | 12.4 | 11.5 | -9.9 |
| Québec | 11.6 | 11.5 | 10.3 | 9.2 | 8.4 | 8.9 | 9.0 | 8.2 | 9.5 | -29.3 |
| Ontario | 9.9 | 9.2 | 9.7 | 9.5 | 10.5 | 10.1 | 10.0 | 8.7 | 9.4 | -12.1 |
| Manitoba | 10.8 | 10.0 | 10.3 | 9.7 | 9.7 | 10.1 | 9.1 | 8.2 | 7.8 | -24.1 |
| Saskatchewan | 13.2 | 11.9 | 10.8 | 11.2 | 12.2 | 12.5 | 12.7 | 10.4 | 9.1 | -21.1 |
| Alberta | 11.0 | 9.9 | 8.6 | 10.5 | 10.1 | 8.1 | 6.8 | 6.6 | 5.9 | -39.9 |
| British Columbia | 16.8 | 14.7 | 15.7 | 14.8 | 13.8 | 12.8 | 12.3 | 10.4 | 11.5 | -38.3 |
| All of Canada | 11.9 | 11.0 | 10.9 | 10.6 | 10.6 | 10.2 | 10.0 | 8.8 | 9.5 | -25.8 |
Source: Statistics Canada, Survey of Labour and Income Dynamics (2000-2008). Compilation: Institut de la statistique du Québec.
Some conclusions can be drawn from this table:
- All provinces experienced a significant decline in poverty during the period from 2000 to 2007, but the four provinces at the extremities of the country (Newfoundland and Labrador and Prince Edward Island to the east, Alberta and British Columbia to the west) experienced the largest decrease. The Québec situation is in the middle, with a decrease of 29.3% over the past seven years;
- Regarding the incidence of poverty, with a rate of 8.2% in 2007, Québec is tied with Manitoba and is surpassed only by Alberta, which has a rate of 6.6%;
- Québec, Ontario, Manitoba and Alberta have a poverty rate lower than that of all of Canada, which is 8.8% including Québec. If we exclude Québec from these data, the poverty rate for Canada as a whole is 9.0%.
- In this section, we used the Market Basket Measure, which indicates the incidence of poverty, that is to say, the proportion of the population having incomes below predetermined thresholds. However, this indicator does not measure the depth of poverty (it can be a bit below the threshold or way below the threshold), nor the distribution of this depth among the different categories of poor households.
To analyze this depth, indicators were developed from data based on the Low Income Measure. In this document, we will use two indicators: the Normalized Deficit Index, which indicates the incidence and depth of poverty, and the Severity Index, which measures both the incidence and depth of poverty and the distribution of that depth. The latter paints a much more comprehensive portrait of the poverty phenomenon in a society. A research team (Brochu, Makdissi and Toahan, 2011) calculated these indicators from Statistics Canada's[3] Low Income Measure for each province and used them to evaluate the performance of Québec and other provinces for the 1996-2006 period. It is not possible within the framework of this paper to present all the results. We can summarize the main results as follows:
- Extreme poverty: in 1996, New Brunswick was the province with the least extreme poverty, followed closely by Québec. In 2006, extreme poverty had declined in all provinces, with Québec now ranking first, followed closely by Alberta;
- Depth of poverty: in 1996, New Brunswick was the province where the depth index was lowest, followed again by Québec. In 2006, Alberta had the lowest index, followed by Québec;
- Severity of poverty: in 1996, Newfoundland, Prince Edward Island and New Brunswick had higher scores than Québec. In 2006, only Prince Edward Island continued to have a better result than Québec.
Given the above, one can conclude that Québec has made significant progress in terms of poverty reduction during the 2000s. However, these gains are uneven and leave out important segments of the population (especially single people). For other groups, such as families with children, the gains have been considerable. Compared to other provinces, Québec seems to have done well.
But what about Canada's position relative to other industrialized countries of the OECD? If Québec does better than Canada and Canada improves its position in relation to the other OECD countries, we can conclude that Québec is on the right track towards the achievement of its objective of progressively joining the ranks of the industrialized nations having the least number of people living in poverty by 2013.
Canada and Québec in the World
To measure poverty at the international level, the OECD uses the index of Low Income Measure defined as half of the after-tax median income in each country.
In the mid-2000s, with a poverty rate of 11.7%, Canada ranked 19th out of 30 countries for the poverty rate. The average of the OECD countries amounted to 10.6% then. At the extremes were Mexico, with a rate of 18.4%, and Denmark and Sweden with a rate of 5.3%. As for Québec, in 2005, the poverty rate stood at 9.6%, which placed it more than 2% below the Canadian threshold and 1% below the average of the OECD countries.
Part 2.
The Evolution of Income Inequalities
There is a link between the incidence of poverty in a society and relative inequality in income distribution. There are several techniques to measure this degree of inequality. To do so, one can calculate the share of income for each segment of the population divided into percentiles, deciles or quintiles and measure its evolution over time. Another technique is to calculate various inequality coefficients called Gini coefficients. These indexes are calculated on a scale of 0 to 1. A coefficient of 0 indicates that revenues are evenly distributed in society; that is to say, they are identical for all members of society (absolute equality). An index of 1 demonstrates that all society incomes are monopolized by one person (absolute inequality). So, the closer the index is to 0, the more even the income distribution is; the closer it is to 1, the more uneven the income distribution is.
The Gini coefficient is complementary to various poverty indicators and can inform us about the effectiveness of strategies to reduce economic inequality. The Gini coefficient can be calculated for different types of households or for all individuals. Here, we present only the Gini coefficient for all family economic types, including households composed of a single person. At the international level, a standardized Gini coefficient is used to compare income inequality in various countries.
In this paper, we will study the evolution of two Gini coefficients: the first, called "market", is computed for market income (before-tax gross income), the second, called "disposable income", is calculated on the basis of the available income of individuals, that is to say, after subtracting taxes and adding social benefits. The difference between these two indicators reflects the redistribution efforts of the fiscal and social policies of the various governments.
We present the evolution of both Gini coefficients for Québec from 1976 to 2009 in Figure 1 below.
Figure 1. Gini Coefficient, Income Adjusted Before and After Taxes and Transfers, Québec, from 1976 to 2009
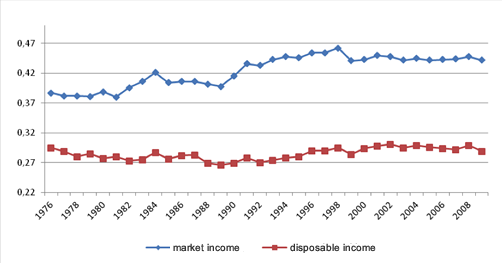
Source: Statistics Canada, Table 202-0709
(Figure reproduced from Lamoureux and Bourque, 2011).
As in most industrialized countries, market income distribution in Québec has become less egalitarian since the mid-1970s and has stabilized during the 2000s. As for the distribution of disposable income (after taxes and benefits), an upward trend began in the late 1980s, but a stabilization occurred during the 2000s. The difference between the two curves measures the impact of public interventions in the form of taxation and social benefits. This difference grew significantly from 1976 to 1988, decreased at the turn of the 21st century, and has stabilized since.
In what follows, we will study the evolution of inequalities in Québec during the 2000s and compare the situation of Québec to other Canadian provinces.
For the more recent period, from 2000 to 2008, there are slight variations in the inequality of market income in all Canadian provinces, as shown in Table 3 below. Five provinces (Nova Scotia, Québec, Ontario, Manitoba and British Columbia) saw income inequality increase slightly over the period while, in other provinces, inequality declined. For all of Canada, inequalities in market income distribution are the same in 2000 and 2008 (43.9%).
| 2000 | 2001 | 2002 | 2003 | 2004 | 2005 | 2006 | 2007 | 2008 | |
|---|---|---|---|---|---|---|---|---|---|
| Provinces | (points) | ||||||||
| Newfoundland and Labrador | 50.1 | 49.7 | 50.1 | 49.8 | 49.3 | 49.6 | 49.1 | 48.1 | 48.0 |
| Prince Edward Island | 43.8 | 43.0 | 44.3 | 41.7 | 41.3 | 40.4 | 41.1 | 39.9 | 41.4 |
| Nova Scotia | 43.8 | 44.1 | 44.2 | 43.2 | 42.3 | 42.0 | 42.2 | 42.6 | 44.3 |
| New Brunswick | 43.8 | 44.3 | 44.6 | 45.1 | 44.9 | 44.2 | 44.8 | 44.3 | 42.4 |
| Québec | 44.3 | 45.0 | 44.8 | 44.2 | 44.5 | 44.2 | 44.3 | 44.4 | 44.8 |
| Ontario | 43.7 | 43.4 | 43.0 | 43.2 | 44.4 | 43.0 | 43.0 | 43.1 | 43.8 |
| Manitoba | 41.1 | 41.0 | 42.0 | 41.9 | 41.8 | 41.6 | 42.4 | 43.0 | 41.3 |
| Saskatchewan | 42.6 | 42.5 | 42.7 | 42.9 | 43.0 | 44.5 | 44.1 | 43.4 | 41.8 |
| Alberta | 41.1 | 40.4 | 39.2 | 40.6 | 40.1 | 39.3 | 40.9 | 40.6 | 40.3 |
| British Columbia | 42.7 | 43.9 | 45.4 | 43.7 | 43.7 | 43.2 | 42.6 | 41.6 | 43.1 |
| Canada | 43.9 | 44.0 | 43.9 | 43.7 | 44.2 | 43.5 | 43.6 | 43.5 | 43.9 |
* To facilitate reading of the Gini coefficient tables, these data are presented in units (1 to 100) rather than decimals (0 to 1). Source: Statistics Canada, Table 202-0709.
The provinces with the largest market income inequality (the highest indexes) throughout the entire period are Newfoundland and Labrador and Québec. Conversely, the province with the least inequality is Alberta.
State Intervention
This income distribution is that which would exist without Government intervention. However, the Government intervenes through fiscal policies as well as through social security programs to reduce inequalities.
Thus, the situation is somewhat different when considering the evolution of the Gini coefficient according to disposable income, that is to say, after Government intervention (Table 4).
| 2000 | 2001 | 2002 | 2003 | 2004 | 2005 | 2006 | 2007 | 2008 | |
|---|---|---|---|---|---|---|---|---|---|
| Province | (points) | ||||||||
| Newfoundland and Labrador | 30.2 | 29.0 | 30.5 | 29.6 | 29.9 | 30.2 | 30.0 | 29.9 | 30.7 |
| Prince Edward Island | 28.5 | 27.7 | 28.5 | 26.7 | 26.7 | 25.7 | 26.9 | 25.4 | 27.4 |
| Nova Scotia | 29.5 | 29.8 | 30.2 | 29.5 | 29.2 | 29.3 | 29.4 | 29.6 | 30.1 |
| New Brunswick | 29.1 | 29.0 | 29.1 | 29.7 | 29.8 | 29.3 | 29.5 | 29.4 | 28.1 |
| Québec | 29.4 | 29.8 | 30.1 | 29.5 | 29.9 | 29.6 | 29.4 | 29.2 | 29.9 |
| Ontario | 32.5 | 32.1 | 32.0 | 32.1 | 33.2 | 32.1 | 32.1 | 31.9 | 32.3 |
| Manitoba | 29.0 | 29.1 | 30.5 | 29.5 | 29.7 | 29.8 | 30.4 | 31.0 | 29.8 |
| Saskatchewan | 29.5 | 29.6 | 29.6 | 30.4 | 30.7 | 32.5 | 32.2 | 31.5 | 30.8 |
| Alberta | 31.2 | 31.1 | 29.8 | 31.1 | 31.0 | 30.3 | 31.4 | 31.8 | 31.8 |
| British Columbia | 31.2 | 32.8 | 34.1 | 32.4 | 32.8 | 32.5 | 32.3 | 31.9 | 32.8 |
| Canada | 31.7 | 31.8 | 31.8 | 31.6 | 32.2 | 31.7 | 31.8 | 31.6 | 32.1 |
Source: Statistics Canada, Table 202-0709.
Note first that all the coefficients of disposable income in Table 4 are lower than the coefficients of market income presented in Table 3, as tax policies and benefits taken together have the overall effect of reducing inequalities in income distribution in each province. However, the magnitude of the differences between the two indexes varies from province to province, as discussed below.
Despite Government intervention, seven provinces, including Québec, saw inequalities increase from 2000 to 2008. Only Ontario, New Brunswick and Prince Edward Island saw a decrease in inequalities. For all of Canada, the coefficient increased slightly, going from 31.7 to 32.1.
Contribution of Government Actions
It is interesting to measure the relative contribution of fiscal and social policies in reducing income inequalities in each province. We present in Table 5 the gap between the market coefficient of Table 3 and the disposable income coefficient of Table 4 for the year 2008.
| Province |
Gini (market) (points) |
Gini (disposable income) (points) |
Difference (points) |
Difference (%) |
|---|---|---|---|---|
| Newfoundland and Labrador | 48.0 | 30.7 | -17.3 | -36.0 |
| Prince Edward Island | 41.4 | 27.4 | -14.0 | -33.8 |
| Nova Scotia | 44.3 | 30.1 | -14.2 | -32.1 |
| New Brunswick | 42.4 | 28.1 | -14.3 | -33.7 |
| Québec | 44.8 | 29.9 | -14.9 | -33.3 |
| Ontario | 43.8 | 32.3 | -11.5 | -26.3 |
| Manitoba | 41.3 | 29.8 | -11.5 | -27.8 |
| Saskatchewan | 41.8 | 30.8 | -11.0 | -26.3 |
| Alberta | 40.3 | 31.8 | -8.5 | -21.1 |
| British Columbia | 43.1 | 32.8 | -10.3 | -23.9 |
| All of Canada | 43.9 | 32.1 | -11.8 | -26.9 |
We see that in Québec, Government intervention has succeeded in reducing the inequalities produced by the market by one-third in 2008 (from 44.8 to 29.9). While Québec in 2008 recorded the second-largest inequality in market income distribution (index of 44.8), after Newfoundland and Labrador (48.0), it ranked 7th for inequalities after the intervention of the Government (29.9). Only the provinces of Prince Edward Island, New Brunswick and Manitoba have a more egalitarian distribution of disposable income than Québec.
Québec, with a difference of one-third, compares favorably with Canada as a whole (26.9%) and even more favorably with all other Canadian provinces, that is to say, Canada minus Québec.
Canada in the World
If income distribution is more egalitarian in Québec than in Canada as a whole, internationally, Canada and Québec fare worse than most countries that have a comparable level of economic development (Table 6).
|
Gini before taxes and transfers (points) |
Gini after taxes and transfers (points) |
Impact of the redistribution (points) |
Impact of the redistribution (%) |
|
|---|---|---|---|---|
| Denmark | 41.7 | 23.2 | -18.4 | -44.1 |
| Sweden | 43.2 | 23.4 | -20.6 | -47.7 |
| Austria | 43.2 | 26.5 | -16.8 | -38.9 |
| Belgium | 49.4 | 27.1 | -22.3 | -45.1 |
| Netherlands | 42.3 | 27.1 | -15.2 | -35.9 |
| Norway | 43.3 | 27.6 | -15.7 | -36.3 |
| France | 48.2 | 28.1 | -20.1 | -41.7 |
| Québec (2006) | 44.3 | 29.4 | -14.9 | -33.6 |
| Germany | 50.7 | 29.8 | -20.9 | -41.2 |
| Canada (2006) | 43.6 | 31.8 | -11.8 | -27.1 |
| United Kingdom | 46.0 | 33.5 | -12.5 | -27.2 |
| Italy | 55.7 | 35.2 | -20.5 | -36.8 |
| United States | 45.7 | 38.1 | -7.6 | -16.6 |
Source: adapted from Goudswaard et al (2010:6) for countries other than Canada and Québec. Statistics Canada, Table 202-0709. (Table reproduced from Lamoureux and Bourque 2011).
Canada ranks 10th among 12 countries regarding equality in the distribution of disposable income. By integrating Québec in this table, it would be 8th out of 13 countries, between the most egalitarian countries, such as Denmark and Sweden, which lead the way with Gini coefficients of 23.2 and 23.4 respectively, and the least egalitarian ones, Italy and especially the U.S., with indexes of 35.1 and 38.2 respectively.
Part 3.
Poverty Among People with Disabilities
As the Office des personnes handicapées du Québec (OPHQ) pointed out in its brief on Bill 112, "people with disabilities and their families continue to be overrepresented among groups hit hardest with poverty and social exclusion". It should be noted that only 35% of disabled people aged 15 to 64 years are employed in Québec, while the proportion doubles for the entire population of this age group (CCLP, 2009:32).
When trying to identify the reality of poverty among disabled people in Canada and in each province, we have to deal with a significant lack of statistical information. This is very unfortunate, frankly unacceptable, given the serious impact of this phenomenon on this group of citizens. In fact, the only available data come from the Canadian Participation and Activity Limitation Surveys (PALS) of 2001 and 2006, which use the after-tax Low Income Cut-Offs from Statistics Canada.
Here are some data for all of Canada according to the 2006 PALS:
- People with disabilities represent 16.5% of Canadians aged 15 and over, almost 4.2 million people;
- 20.5% of disabled people aged 15 to 64 live below the after-tax low income cut-off from Statistics Canada, compared to 10.7% for the entire population of this age group;
- 31% of Canadians with disabilities living alone live in poverty compared with 21.3% of their peers without disabilities;
- Over 50% of disabled persons living with other unrelated persons (e.g.: as roommates, in boarding homes or in group living situations) live below the poverty threshold, compared to 36.3% of their peers without disabilities;
- 21.3% of single parents with disabilities live below the Low Income Cut-Off compared to 18.4% of single parents without disabilities.
The 2001 and 2006 PALS contain a series of provincial data whose objective is to enable the reader or researcher to compare the situation, sometimes significant, between the provinces and to measure changes over time. Thus, Table 7 shows the low income rate for persons with and without disabilities, for Canada as a whole and for the provinces in 2006.
| Province | Without disabilities | With disabilities |
|---|---|---|
| Newfoundland and Labrador | 9.1% | 22.9% |
| NB and PEI | 7.7% | 17.3% |
| Nova Scotia | 8.9% | 16.8% |
| Québec | 12.0% | 32.0% |
| Ontario | 10.3% | 13.3% |
| Manitoba | 9.7% | 20.1% |
| Saskatchewan | 9.5% | 17.4% |
| Alberta | 8.5% | 13.7% |
| British Columbia | 13.2% | 19.6% |
| All of Canada | 10.7% | 20.3% |
Source: 2006 PALS.
For Canada as a whole, the data indicate that the incidence of poverty among people with disabilities is 1.9 times higher than among people without disabilities. For the provinces, this factor varies from 1.5 in British Columbia to 2.7 in Québec. By examining the figures, we note that the low income rate among people with disabilities in Québec amounted to 32.0%, a figure much higher than those in other provinces, which ranges from 13.3% in Ontario to 22.9% in Newfoundland and Labrador.
For reasons that we explain below, and in even greater detail in Appendix 1, it appears risky, at the very least, to compare the situation in Québec with that of other Canadian provinces and with that of Canada as a whole.
First, as emphasized at the beginning of the text, the Low Income Cut-Offs use Canadian national data, which has the effect of significantly underestimating the low-income rates in provinces where the average is greater than the Canadian average (Ontario) and overestimating these rates in provinces where the average income is lower than the Canadian average (Québec) (Lanctôt and Fréchet, 2002).
Second, according to the OPHQ (OPHQ, 2008: Appendix A), the data for Québec suffer from a serious anomaly which is reflected in several statistics from the PALS, which are used to make interprovincial comparisons (Crawford, 2010). Firstly, says the OPHQ, responses from Québec to the PALS significantly underestimate the presence of a disability. Accordingly, Québec is the province where the disability rate is the lowest among all Canadian provinces, in the 2001, as well as in the 2006 PALS. In 2006, Québec had a disability rate of 11.9% versus 16.6% for all of Canada. Secondly, the relative proportion of people with mild disabilities is much lower in Québec (30.4%) than in all of Canada (34.1%), while the percentage of people with a severe or very severe disability is much higher in Québec (46.1%) than in Canada (40.9%). Finally, it is shown that poverty or low income rates increase with the severity of disability (Crawford, 2010: ISQ, 2010)
That being said, what does the survey data from 2001 and 2006 on poverty and its evolution among people with disabilities in Québec reveal?
| With disabilities | Without disabilities | ||
|---|---|---|---|
| Number | % | % | |
| All | 164,610 | 22.9 | 11.4 |
| Sex | |||
| Men | 65,700 | 20.5 | 10.4 |
| Women | 98,920 | 24.8 | 12.4 |
| Age | |||
| 15-64 years old | 130,100 | 32.0 | 12.0 |
| 65 years old and over | 34,510 | 11.0 | 7.5 |
Source: Institut de la statistique du Québec (2010), Table 4.7.
In Table 7, we can see that the incidence of low income is twice as high among people with disabilities aged 15 and over (22.9%) than among the 15-year-and-over general population (11.4%). If we examine more closely the impact according to age, it appears that the low-income rate among people with disabilities from 15 to 64 years is almost three times higher than the rate for people with disabilities aged 65 and more.
The low-income rates vary significantly by type of disability, as can be observed in Table 9, which shows these rates by type of disability in the population with disabilities. It amounts to 17.7% for people with hearing impairments and 40.8% for those with psychological problems.
| Type of disability | Having this type of disability | Not having this type of disability |
|---|---|---|
| Hearing | 17.7% | 24.8% |
| Speech | 29.3% | 22.1% |
| Learning | 31.9% | 21.1% |
| Intellectual deficiency or developmental disability | 39.0%* | 22.2% |
| Psychological | 40.8% | 20.0% |
A person may present more than one type of disability. The analysis compares people with a given type of disability with those without this type of disability. Only the types of disability for which a significant difference is observed are presented.
* To be interpreted with caution.
Source: 2006 PALS, Statistics Canada. Treatment: Institut de la statistique du Québec.
Table taken from the Institut de la statistique du Québec (2010), Table 4.8.
To conclude this section, despite the reservations we have raised about the reliability of these data, we present in Table 10 the evolution of low-income rates from 2001 to 2006 for the population 15 years and over with disabilities in Québec.
| Population with disabilities | 2001 | 2006 | Change |
|---|---|---|---|
| All | 32.7% | 22.9% | -30.0% |
| Men | 29.0% | 20.5% | -29.3% |
| Women | 35.6% | 24.8% | -30.3% |
| 15-64 years | 36.2% | 32.0% | -11.6% |
| 65 years and over | 27.9% | 11.0% | -64.2% |
Source: 2001 and 2006 PALS, Statistics Canada. Treatment: Institut de la statistique du Québec).
Source: Institut de la statistique du Québec (2010), Figure 4.2.
Age appears to be the determining factor in the incidence of poverty among disabled persons. When considering the population as a whole, the rate of reduction in the number of disabled people with low incomes is similar in men and women. However, the incidence of low income still remained higher among women, in both 2001 and 2006. As well, people with disabilities of working age (15 64 years) had the highest rates of low income; they also were the people whose situation improved the least from 2001 to 2006 (-11.6%).
If we compare the data in Table 10 to those in Table 1 which shows the evolution of poverty for the entire population of Québec, it appears that the reduction in poverty between 2001 and 2006 among disabled people was greater (-30.0%) than in the general population (-20.5%). However, this discrepancy can be mainly explained by the progress made among people with disabilities aged 65 and over. Among people aged 15 to 65, the situation is quite different: the decrease in the poverty rate among disabled people of this age group (-11.6%) is slightly lower than that of the general population of the similar age group (-13.4%).
Conclusion
As suggested by the definition used in the Québec Act to combat poverty and social exclusion, poverty is a multidimensional phenomenon that cannot be reduced to a question of insufficient income. That is why organizations like the CEPE (Québec centre for study on poverty and exclusion) are working to develop a series of measures and indicators that will identify several other aspects of the issue (CEPE, 2009).
Given the scope of the mandate we were given, this text relies almost exclusively on quantitative data on rates of low income and poverty, and obviously cannot be expected to paint a complete picture of the situation.
It is far too early to decide to what extent the objective of this law aiming "to progressively make Québec, by 2013, one of the industrialized nations having the least number of persons living in poverty" has been reached. Given that there are several-year delays in publishing various poverty surveys and that we are waiting for the development of indicators complementary to the financial data, we will probably not know until 2015 or 2016.
That being said, can we, from the data presented in this text, draw a number of findings regarding the relative success of the strategy against poverty adopted by Québec?
Regarding the general population, the picture is very diverse. While the overall trend is a gradual decrease in the poverty rate throughout the period, and although significant gains were made in some important segments of the population (such as families with children), significant problems persist in other groups, particularly among single people and single parent families headed by women; despite certain gains, these groups still had very high rates of poverty in 2008. In the Canadian rankings, Québec has made significant progress, both in terms of the overall poverty rate and the incidence of severe poverty.
Concerning the distribution of disposable income measured by the Gini coefficient, Québec was the most egalitarian province in 2007, after Prince Edward Island, while it was surpassed by three provinces in 2000. Government intervention plays a major role in reducing inequalities in all provinces. This is particularly true for Québec, which in 2007 was the second least egalitarian province when considering market revenues, but the second most egalitarian province when social programs and taxes are factored in.
Poverty rates also remain very high among the most vulnerable groups of society: immigrants, aboriginals and persons with disabilities (CCLP, 2009). We can only deplore the significant lack of statistical information on these groups of people and hope that this will be corrected as soon as possible.
Nevertheless, we used the two Canadian Participation and Activity Limitation Surveys conducted in 2001 and 2006. According to these investigations, the low-income rate among people with disabilities in Québec (measured using the LICOs from Statistics Canada) decreased by 30% over the course of these five years, both in men and in women, although women still had a higher poverty rate than men. This significant decrease should not hide the fact that the incidence of poverty remained very high in 2006. However, it is clear that almost all of the improvements affected older people, whose poverty rate decreased by 64% from 2001 to 2006. Among adults under 65, gains were very modest during the period, about 11%, while the incidence of poverty among this segment was the highest.
We emphasized the fact that PALS data on low-income rates cannot readily be used to compare the situation in Québec to that of other provinces. To do so, we must await the publication of more reliable data that take into account the social and economic conditions specific to each province.
Appendix 1
Provincial Data Not Amenable to Comparison
According to 2001 and 2006 PALS, Québec is the province with disability rates much lower than those found in all other provinces. In 2001, Québec had a disability rate of 9.8% compared to 14.6% for all of Canada. In 2006, these figures were 11.9% and 16.6% respectively. These differences are also found within each province when comparing disability rates of French-speaking individuals to those of English-speaking people. According to the OPHQ "French-speaking people in Québec or elsewhere in Canada, are less apt to report mild disabilities compared to English-speaking individuals, explaining lower disability rates […] This finding has the effect of decreasing disability rates in Québec, predominantly French-speaking".
In addition to underestimating the rate of disability in Québec, the PALS also show that the proportion of people with mild disabilities is lower in Québec than in Canada as a whole, while the proportion of people with severe or very serious disabilities is higher, as demonstrated by the following table which shows the distribution of disabilities by severity, by province and across Canada in 2001.
| Provinces | Light | Moderate | Severe/very severe | Total |
|---|---|---|---|---|
| % | ||||
| Nova Scotia | 34.1 | 26.4 | 39.5 | 100.0 |
| Saskatchewan | 39.8 | 24.2 | 36.0 | 100.0 |
| Prince Edward Island | 37.8 | 29.0 | 33.2 | 100.0 |
| New Brunswick | 33.2 | 26.4 | 40.4 | 100,0 |
| Manitoba | 36.6 | 27.4 | 36.0 | 100.0 |
| British Columbia | 37.1 | 26.7 | 36.2 | 100.0 |
| Ontario | 32.8 | 24.4 | 42.8 | 100.0 |
| Alberta | 38.8 | 25.4 | 35.7 | 100.0 |
| Newfoundland and Labrador | 31,7 | 26,1 | 42.2 | 100.0 |
| Québec | 30.4 | 23,5 | 46.1 | 100.0 |
| Canada | 34.1 | 25.0 | 40.9 | 100.0 |
Source: 2001 PALS
Québec, with its Francophone majority, is the province with the lowest proportion of people with mild disabilities among all persons with disabilities. Thus, 30% of all disabled people suffer from mild disabilities in Québec, whereas in Canada, this proportion is 34%. In some provinces, such as Saskatchewan and Alberta, this proportion is nearly 40%. It can also be noted that the proportion of people with moderate disabilities in Québec is similar to that observed in Canada (23.5% vs. 25%).
As a result, people with severe or very severe disabilities form a larger proportion of the disabled community of Québec than they do in all of Canada and other provinces (46% vs. 40.9% in Canada).
However, as pointed out by the Institut de la statistique du Québec (ISQ, 2010: 103), "The proportion of people aged 15 and over with disabilities who are in a household living below the LICO varies depending on the severity of the disability". For all of Canada, this proportion is 14.6% for those whose disability is mild and rises to 18.3% and 27.3% respectively for those with a disability classified as moderate or severe to very severe (Crawford, 2010), the difference being significant between the two extreme categories of the indicator. For Québec, these figures are 18%, 25% and 26% respectively (ISQ, 2010).
Thus, the low-income rates of people with disabilities in Québec, as they appear in the 2001 and 2006 PALS, cannot readily be compared with other provinces or with Canada as a whole.
Bibliography
- Aubry, François (2010). The Québec Act to Combat Poverty and Social Exclusion: How Does it Tackle the Situation of People with Disabilities?
- Brochu, Pierre; Makdissi, Paul and Toahan, Lynn (2011). Le Québec, champion canadien de la lutte contre la pauvreté in Institut du Nouveau monde (2011), L'état du Québec 2011, Boréal, Montréal.
- CEPE (2009). Prendre la mesure de la pauvreté, proposition d'indicateurs de pauvreté, d'inégalités et d'exclusion sociale afin de mesurer les progrès réalisés au Québec.
- CEPE (2008). Le faible revenu au Québec : un état de situation, Québec.
- CCLP (2009). Prévention de la pauvreté persistante. Revoir nos façons de faire : un choix judicieux et humain. Statement.
- Crawford, Cameron (2010). Disabling Poverty and Enabling Citizenship: Understanding the Poverty and Exclusion of Canadians with Disabilities.
- Crespo, Stéphane (2008). Annuaire de statistiques sur l'inégalité de revenu et le faible revenu, Institut de la statistique du Québec, Government of Québec.
- Government of Québec (2002). L.R.Q., chapitre L-7: Loi visant à lutter contre la pauvreté et l'exclusion sociale. Québec, Québec official editor.
- Institut de la statistique du Québec (2010). Vivre avec une incapacité au Québec, Government of Québec.
- Lamoureux, Josée and Bourque, Gilles L. (2011). Les inégalités au Québec : si la tendance se maintient…, intervention memorandum published on October 10, 2011, IREC.
- Lanctôt, Pierre and Fréchet, Guy (2002). Les seuils de faible revenu « personnalisés » de Statistique Canada : fiche synthèse, Institut de la statistique du Québec.
- Noël, Alain (2011). Une lutte inégale contre la pauvreté et l'exclusion sociale in Institut du Nouveau monde, L'état du Québec 2011, Boréal, Montréal.
- Noël, Alain (2011). Québec's New Politics of Redistribution, to be issued in Banting, Keith and John Myles (eds.), The Fading of Redistributive Politics: Policy Change and Policy Drift in Canada, Vancouver, UBC Press, 2012.
- OPHQ (Québec office of disabled people) (2008). À part entière : Pour un véritable exercice du droit à l'égalité, companion document.
- Statistics Canada (2000-2008). Survey of Labour and Income Dynamics.
- Statistics Canada (2001). Participation and Activity Limitation Survey.
- Statistics Canada (2006). Participation and Activity Limitation Survey.
- Statistics Canada, Table 202-0709.
- [1] Statistics Canada has consistently refused to consider low-income indicators as poverty thresholds, but many agencies have always used them for this purpose, in the absence of official relative poverty thresholds.
- [2]The 30% threshold of the median can be used as an indicator of extreme poverty.
- [3]The moderate poverty index is calculated as the half of the median income while the extreme poverty index is calculated as 30% of the median income.

End Exclusion supporters rally in support of an accessible and inclusive Canada.